
The Fed surprise resulted in a significant decline in longer term interest rates with the TNX declining below 2.5% and the TLT hitting 125. In this weeks options OI, I will show the TLT OI thru June which shows that the rate decline may only be temporary.
With the Fed now supportive of the stock market, this will likely increase the probably of a stronger stance on trade by Trump, thereby increasing the probability of the "nuclear option". If the Mueller findings turn out to be negative, Trump may feel he has nothing to lose.
I. Sentiment Indicators
The overall Indicator Scoreboard (INT term, outlook two to four months) bearish sentiment rose mildly and seems to be following a downward pattern similar to Aug-Oct 2018.

The INT view of the Short Term Indicator (VXX+VXXB $ volume and Smart Beta P/C, outlook two to four months) bearish sentiment has spiked upward to about the same level as the SPX 100pt decline in mid Mar.

Bond sentiment (TNX) is still looking like the Jun-Sep 2018 period where a three month consolidation was seen before a sharp runup in rates. Surprisingly bearish sentiment spiked early last week before the late week decline. In the options OI, the TLT options show a consolidation at the current level may occur into mid-Apr.

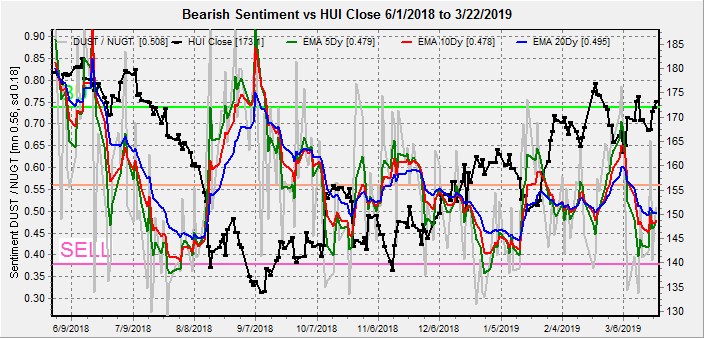
For the INT outlook with LT still negative, the gold miners (HUI) bearish sentiment improved somewhat with the positive effect of lower rates offset by a late rebound in the US dollar.

And for the ST, the H&S pattern remains viable.
II. Dumb Money/Smart Money Indicators
The Risk Aversion/Risk Preference Indicator (SPX 2x ETF sentiment/NDX ETF sentiment, outlook 2 to 4 days/wks) as a INT indicator was unchanged for the week.

The option-based Dumb Money/Smart Money Indicator as short/INT term (outlook 2 to 4 days/weeks) showed a large drop in bearish sentiment matching the Sep 2018 SPX highs, but was virtually unchanged with the Fri selloff.

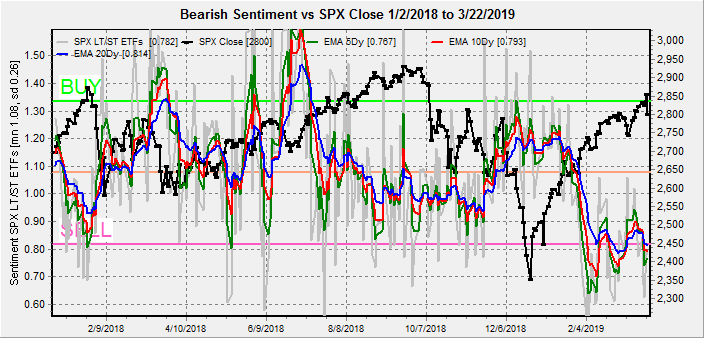
The INT term SPX Long Term/Short Term ETFs (outlook two to four weeks) bearish sentiment fell again, but this time due to a large spike in smart money (3x) selling. Shown in Tech/Other, this happened twice in 2018 - once on the Mar retest and later early Dec before the crash.
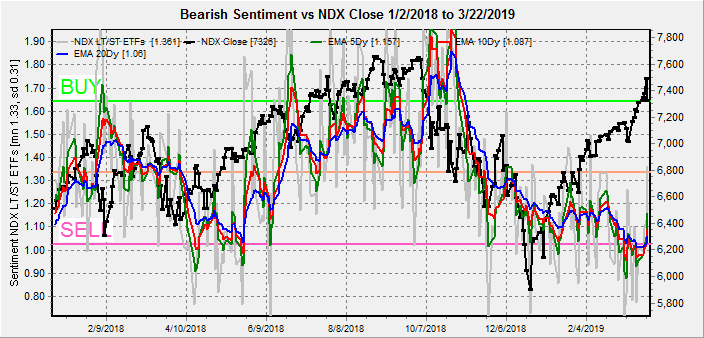
Long term neutral, the INT term NDX Long Term/Short Term ETF Indicator (outlook two to four weeks) saw a modest improvement with the sharp NDX selloff.
III. Options Open Interest
Using Thurs close, remember that further out time frames are more likely to change over time, , and that closing prices are more likely to be effected. This week I will look out thru Apr 5.
First a look at Fri OI as of Thurs close, with only a very small net put OI at 2800 and above and firm call resistance at 2850, it is no wonder prices fell as they did.

With Fri close at SPX 2800, Mon shows very little net put support above 2790, so prices may fall slightly. The first strong support is at 2750 if there is a major negative news event (Mueller). Light open int overall.

Wed is more likely to rally if the SPX can hold 2800, where there is strong resistance at 2850, but little put support to push prices higher.

Fri, EOM, is more likely to drop below SPX 2800 and depending on changes during the week, a drop below 2775 could go all the way to 2725. Large open int.

For following Fri, jobs report, a pin between SPX 2775 and 2800 is likely. Large open int.

Currently the TLT is 125 with the TNX at 2.45%. Apr exp show that puts should keep the TLT at 122 or higher with fairly large net call resistance at 125. ST prices may go higher but should remain at/below 125 by mid-Apr. Obviously, over 125 there is no resistance.

For May exp, large put support drops to 118-9 and call resistance drops to 122 with a likely close at 121.

for Jun exp, large put support drops to 117 with large call resistance at 122 and a likely close 118-121. A move to 118 should put the TNX at 2.85%.

IV. Technical / Other
One of the reasons I have not been particularly bearish is that the overall Put/Call (less VIX options) CPC Revised seems to be following the Aug-Oct 2018 pattern, but ST does not indicate a bottom.

A closer look at the SPX ETFs showed an interesting divergence as the dumb money (2x)
moved from strong buying to neutral.

While the smart money (3x) rose sharply from the neutral position, the question is whether this points to an Apr or Dec 2018 outcome.

One sign of complacency that may be an early warning is the $SKEW. As shown below in circles the Oct-Dec 2018 decline started with a falling $SKEW that continued as prices fell. A more likely option is the Jan-May 2015 period where a sideways to lower $SKEW preceded a topping pattern of several months.

Conclusions. Sentiment is not giving a clear direction at this time and last week's outlook still seems relevant as a retest of the SPX 200 SMA at 2755 seems likely before ST sentiment moves to a point where a rally back to the mid 2800s is possible. Bonds (TLT options OI) show that the current recession scare is likely overdone and that economic strength is likely to return in May-Jun.
Another factor that may put a tailspin into Trumps trade agenda is the fallout from the recent record flooding in the Midwest. Much higher prices are possible for soybean and grain products that means higher feed prices for livestock then higher meat and dairy prices. I've already noticed a 20% increase in some grain products the last few weeks. This will kill agriculture exports and inflate the trade deficit even more.
Weekly Trade Alert. Lower prices seem likely and the options OI show the potential for a midweek rally next week, followed by a sharp decline on Fri.. Updates @mrktsignals.
Investment Diary, Indicator Primer, update 2018.03.28 Dumb Money/Smart Money Indicators
Article Index 2019 by Topic
Article Index 2018 by Topic
Article Index 2017 by Topic
Article Index 2016 by Topic
Long term forecasts
© 2019 SentimentSignals.blogspot.com
Hi Arthur
ReplyDeleteYou nailed the 2800 close for Friday
Great work
On Thursday l thought it had no chance.
Doubting Thomas no more