
The Wed Update showed that the early week's move over SPX 2800 opened up a move to the call resistance at 2815 and 2825 at the optn exp close on Fri, and even though the high for the day was 2831, the 2825 resistance pulled the close down to 2822. I still think a tradeable high will be reached Wed with a likely "sell the news" event of the FOMC results. Options OI show that a drop by the EOM is possible to SPX 2725-50.
A couple of weeks ago I introduced a "new" VIX Call Indicator (smart money) that gave a SELL before the early Mar decline. This week I noticed a large increase in VIX put buying and decided to use the same criteria as a "dumb money" indicator for VIX puts. More in Tech/Other.
Trader Joe came out with an excellent analysis Wed & Thur that graphically shows both my ST and INT outlook for EW aficionados. More in conclusion.
I. Sentiment Indicators
The overall Indicator Scoreboard (INT term, outlook two to four months) bearish sentiment has moved down from neutral and may be following the Jun-Oct 2018 pattern as the SPX works higher for an INT top.

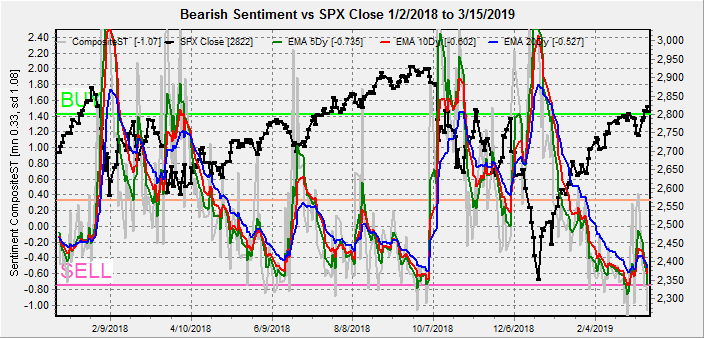
The INT view of the Short Term Indicator (VXX+VXXB $ volume and Smart Beta P/C, outlook two to four months) bearish sentiment has also turned back down, warning of limited upside and INT top approaching.
Bond sentiment (TNX) is still looking like the Jun-Sep 2018 period where a three month consolidation was seen before a sharp runup in rates. A brief spike in bearishness early in the week turned down as rates fell.

For the INT outlook with LT still negative, the gold miners (HUI) bearish sentiment fell sharply last week and may be warning of a downturn. More in options OI section for GDX.

And for the ST, the H&S pattern may still be valid with low bearish sentiment warning of a downturn.

II. Dumb Money/Smart Money Indicators
The Risk Aversion/Risk Preference Indicator (SPX 2x ETF sentiment/NDX ETF sentiment, outlook 2 to 4 mns/wks) as a INT indicator has also turned down as the recent rally may be nearing an end.

A similar measure using stocks/bonds (SPX/TNX ETF) sentiment that I show occasionally, warned that low bearish levels for bonds compared to stocks could cause money to flow into stocks from bonds.

The option-based Dumb Money/Smart Money Indicator as short/INT term (outlook 2 to 4 mns/wks) has moved down levels that saw short term pullbacks between the May-Oct 2018 advance.

Its sister Hedge Ratio shows tha the level of hedging (insurance) has also dropped sharply, increasing the potential for sharp declines.

The INT term SPX Long Term/Short Term ETFs (outlook two to four weeks) bearish sentiment continues to hover at low levels as smart (3x) money remains neutral.

Long term neutral, the INT term NDX Long Term/Short Term ETF Indicator (outlook two to four weeks) remains at low levels similar to the SPX ETF Indicator as smart (3x) money is neutral.

III. Options Open Interest
Using Thurs close, remember that further out time frames are more likely to change over time, , and that closing prices are more likely to be effected. This week I will look out thru Mar 29.
With Fri close at SPX 2822, Mon call hedging will have a positive effect if prices remain over 2820 and could push toward 2840. A move below 2820 could easily reach 2800 (first put support) or lower. Moderate open int overall.


Fri has very large open int with call resistance probably capping prices at 2810. The large overlaps between 2750 and 2800 may result in volatility in that range. A move below the 2750 puts and 2745 calls could drop to 2725.

For Mar EOM, SPX has very large open int with strong call resistance at 2800 and little net resistance down to 2725 similar to the previous Fri.

I also wanted to take a look at the GDX as a gold miner proxy. Here for Fri exp you can see a possible high at 22.5 with some downward pressure due to calls at lower prices and the GDX high was 22.58 with a close at 22.30.

For the Apr exp there is more downward pressure where call resistance should push prices down toward 21 as long as prices don't rise above 23. Not a large decline and may be volatile with some reaction to SPX prices, but it could mean the beginning of the H&S top.

IV. Technical / Other
A surge in VIX put buying last week lead me to look at the VIX put volume using the same criteria as the "new" VIX Call Indicator. The result is a similar "dumb money" indicator, where an increase of 0.5 or 50% of the mean would indicate a SELL when the SPX is above the 20 SMA (0 line). This actually works better as a ST indicator generating 8 SELLs vs 4 for the Call Indicator. For 2018, this includes early Mar, mid Apr, mid Jun (.45), mid Sep, and early Nov. For 2019, last week (.5) and weak (.4) in early Jan and early Feb. This indicator may work better ST since the lead times are generally days, not weeks (except Sept 2018), but the declines may also be shallower.

Conclusions. Overall sentiment indicators have dropped to similar levels as early Mar when we saw a 95 pt drop in the SPX. Trader Joe thinks we may be in an ending diagonal that could mean a similar drop to SPX 2740ish before a final move up to SPX 2840-50 then an decline to 2640. Options OI indicates this drop is likely the next two weeks, and since the China trade talks were put off to April, we have the possibility of another hope rally afterwards into mid Apr that fits TJs scenario. For the INT term, once the ED is complete the bigger picture to complete this B-wave would be a sharp decline to 2640 to fill the late Jan gap (possible Mueller results, trade disappointment) then a final rally to test the Jan 2018 highs at SPX 2875 before a C-wave down. Possible timing may indicate a late Apr-mid May drop to SPX 2640 to get the CNBC pundits warning "sell in May" then a final summer rally for the B-wave. With 2019 starting out as the strongest year since 1987, it would be fitting to see a July top also similar to 1987.
Weekly Trade Alert. Wed (FOMC) may provide a ST top in the range of 2830-40. Last Wed was the highest SPX volume at 3.7M (Stockcharts) since the Sept 2018 optn exp top at 4M, except the Dec panic lows at 5M, and could have been the high at 2831. A pullback is expected into EOM to about 2740 before the next rally. Updates @mrktsignals.
Investment Diary, Indicator Primer, update 2018.03.28 Dumb Money/Smart Money Indicators
Article Index 2019 by Topic
Article Index 2018 by Topic
Article Index 2017 by Topic
Article Index 2016 by Topic
Long term forecasts
© 2019 SentimentSignals.blogspot.com
No comments:
Post a Comment