
Quarterly optn exp highs tend to be significant as the high volume is usually distribution, and last Fri at SPX 3B shares (stockcharts) was about 70% higher than the recent 1.8B avg. The last comparable high was Sept 2018, where a 2-3% pullback was followed by a slightly higher high in Oct. This years first half has been the best since 1987 which saw the high for the year in Aug before a pullback started. We may see something similar this year.
Thanks for the positive comments the last two weeks. Readership has picked up sharply recently to over 15k page views/mn, the AI bots must be watching me. In the Tech/Other section this week, I will show the early stages of my graphic endeavor into data mining my indicator DB.
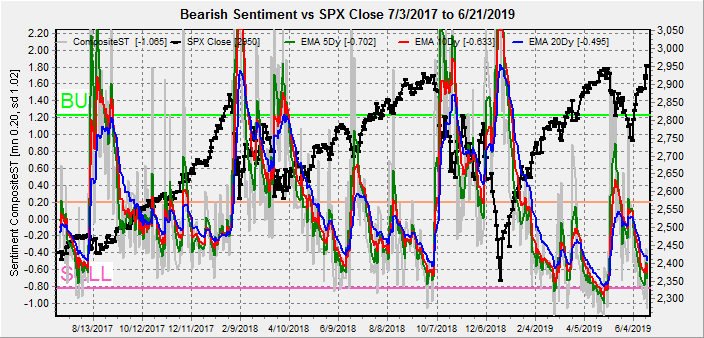
I. Sentiment Indicators
The overall Indicator Scoreboard (INT term, outlook two to four months) bearish sentiment has droped sharply, but longer EMAs (blue) may take a few weeks to reach a SELL level.

The INT view of the Short Term Indicator (VXX+VXXB $ volume and Smart Beta P/C, outlook two to four months) bearish sentiment has dropped even faster that may mean upside is limited or a short term pullback is likely.
Bonds (TNX). Interest rates continue to fall, even though bearish sentiment is very low.

For the INT outlook with LT still negative, the gold miners (HUI) bearish sentiment is similar to bonds where demand for a safe have seems to be overpowering sentiment.

II. Dumb Money/Smart Money Indicators
For this week and possibly for the next several months, I am going to replace the DM/SM ETF indicators with other indicators.
The option-based Dumb Money/Smart Money Indicator as short/INT term (outlook 2 to 4 mns/weeks) has reached levels where ST tops have been seen, but more time is likely needed before a significant decline starts.

And the sister options Hedge Ratio sentiment has fallen very sharply, most similar to what happened with the Nov trading range of SPX 2650-2800. A possible current range of 2850-2950 may occur in a similar fashion.

The INT term SPX Long Term (2x/DM) ETFs (outlook two to four weeks) bearish sentiment does not appear to be low enough to indicate a top.

The INT term NDX Long Term (2x/DM) ETFs (outlook two to four weeks) bearish sentiment also seems to need a lower level to indicate a top.

III. Options Open Interest
Using Wed close, remember that further out time frames are more likely to change over time, and that closing prices are more likely to be effected. This week I will look out thru Jun 28, EOM. Also, this week includes a look at the TLT thru Jul.
With Fri close at SPX 2950, Mon/Wed open int is unusually high, so may be more effective than normal. There is very little put support until 2890 with fairly strong call resistance starting at 2950. SPX 2925-40 looks like the most likely closing target.

Wed is even more bearish with very strong call resistance at SPX 2950 and little put support until 2875. A continued downward push toward SPX 2900-10 is expected, depending on add'l open int added during the week.

Fri is the most bearish with very strong call resistance at 2925 and currently little net put support until 2850. With the G-20 meeting this week in Japan concern may shift from the global CBs to US vs China over trade and Hong Kong. A drop down to or below SPX 2900 is expected based on current positions.

The TLT 20 year bond fund is used as a proxy for interest rates. For the last several years when the TNX was 112 when the TNX was 3.2% (11/2018), the TLT was 124 when the TNX was 2.5% (12/2017), and the TLT was 140 when the TNX was 1.5% (08/2016).
Currently the TLT is 131.4 with the TNX at 2.7%. For Jul, incredibly huge put support below 129 likely guarantees that rates don't rise much over the next month, while modest put support over 132 may keep rates from falling.

IV. Technical / Other
I'm going to show a little background for my graphics interface to the main DB that I will be using for some data mining from time to time. So far I have added most of the put call ratios I use plus some of the indicators from the overall composite. First, looking at the three main P/C ratios as raw data, you notice that Equity P/C (green) is very low as most of the "long" option positions are in individual stocks, while "short" positions use ETFs (red) for hedging and SPX (blue) for "short" speculation. But comparison is difficult due to size differences and volatility. Data is only thru Thurs.

So next to reduce the volatility, I used the 10 day SMA and 20 day for the index. Much easier to read, but still hard to compare.

So finally, I standardize by subtracting the mean and dividing by the std dev. It's still hard to draw definite conclusions, but ETF P/C appears to be the best at identifying tops, while Equity and SPX are best at identifying bottoms.

For running the show, I created a console to select indicators for comparison and will probably be adding a lot more options.

Conclusions. Overall bearish sentiment for the SPX has declined sharply with the rally over the last three weeks, but has not fallen to the level that indicates an INT top. Comparisons to the triple witch tops of 2018 and 1987 indicate that a month or two may go by before a significant decline. Draghi's "ready to do whatever it takes" ignited the markets Tue, but the underlying concern of why more support may be needed was unclear and reminds me of the adage that "when the US sneezes, the rest of the world catches a cold". More significant economic risks may be lurking outside the US.
Weekly Trade Alert. Next weeks G-20 summit may provide an excuse to start a 2-3% pullback toward the SPX 2850 level before a final push into Jul/Aug. Updates @mrktsignals.
Investment Diary, Indicator Primer, update 2019.04.27 Stock Buybacks, update 2018.03.28 Dumb Money/Smart Money Indicators
Article Index 2019 by Topic
Article Index 2018 by Topic
Article Index 2017 by Topic
Article Index 2016 by Topic
Long term forecasts
© 2019 SentimentSignals.blogspot.com
Love the comment "Readership has picked up sharply recently to over 15k page views/mn, the AI bots must be watching me"
ReplyDeleteMeans I may need to begin thinking about fading your analysis lol
ReplyDeleteA must read every weekend. Thanks again Arthur.
ReplyDelete