
The recent move down in int rates in Mar caused the TLT to move from 118 to 126.5 or a move of 7.2%, comparable to the SPX rise in Jan of 2018 from 2670 to 2872, or 7.5%. If we see an 8-10% correction in bonds over the next few months, this is an indication that bonds are becoming more volatile and could see much more volatility in the years ahead. For the week the TLT dropped from 126.5 to 124 or 2%, a good start, but options OI show that the TLT may hang around 124-5 for a few weeks.
In the Tech/Other section I will take a look at VIX options where the puts and calls are pointing to a VIX compression for the next 1-2 weeks similar to early June 2018.
I. Sentiment Indicators
The overall Indicator Scoreboard (INT term, outlook two to four months) bearish sentiment dropped to an extremely low level last seen early June 2018 where the SPX continued upward in a low volatility fashion for about a week totaling another 1% rise.

The INT view of the Short Term Indicator (VXX+VXXB $ volume and Smart Beta P/C, outlook two to four months) bearish sentiment also fell, approaching the June 2018 level.

Bearish bond sentiment (TNX) has retreated even as rates bounced back to the 2.5% level.

For the INT outlook with LT still negative, the gold miners (HUI) bearish sentiment improved somewhat that may support higher prices.

For the ST, the rise in bearish sentiment could support a weak bounce.

II. Dumb Money/Smart Money Indicators
The Risk Aversion/Risk Preference Indicator (SPX 2x ETF sentiment/NDX ETF sentiment, outlook 2 to 4 mns/wks) as a INT indicator dropped sharply last week similar to what happened at the June 2018 top.

The option-based Dumb Money/Smart Money Indicator as short/INT term (outlook 2 to 4 mns/weeks) also fell sharply last week to the lowest levels since Dec 2018.

While the options Hedge Ratio shows a somewhat less bearish sentiment that may indicated more time or higher prices before a downturn.

The INT term SPX Long Term/Short Term ETFs (outlook two to four weeks) bearish sentiment remains at very low levels due to smart money (hedge funds etc) being neutral.

Long term neutral, the INT term NDX Long Term/Short Term ETF Indicator (outlook two to four weeks) also remains at very low levels due to smart money (hedge funds etc) being neutral.

III. Options Open Interest
Using Thurs close, remember that further out time frames are more likely to change over time, and that exp date prices are more likely to be effected. This week I will look out thru Apr 12. Also, this week I will look at the TLT.
With Fri close at SPX 2890, Mon shows strong call resistance at 2900 with only light put support down to 2825. Light open int overall.

Wed is unusual with overlapping puts and calls at 2825 and 2850 that could result in volatility, but call resistance is minimal over 2880 and would likely result in higher prices.

Fri, with large open int, may be volatile and currently looks like prices should fall below 2875, but many puts have been added at the last minute for most of this rally so more support is likely by Fri. Apr 12th is currently the deadline for the next Brexit vote, so a surprise is possible.

The TLT 20 year bond fund is used as a proxy for interest rates. For the last several years when the TNX was 112 when the TNX was 3.2% (11/2018), the TLT was 124 when the TNX was 2.5% (12/2017), and the TLT was 140 when the TNX was 1.5% (08/2016).
Currently the TLT is 124 with the TNX at 2.5%. Next week shows strong put support at 123 & 124 so that bond price are likely to rise slightly to 124.5.

Apr exp show that puts should keep the TLT at 122 or higher with fairly large net call resistance at 125 and should remain at/below 125 by mid-Apr. Expt close is 123.
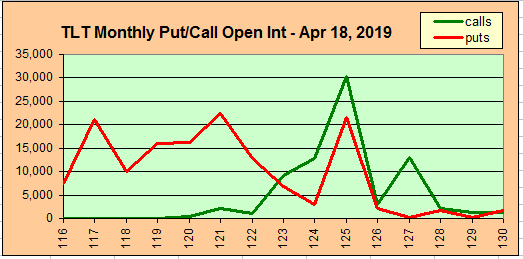
For May exp, large put support has increased at 122 and is likely to keep prices at 123 or higher.

for Jun exp, large put support has increased at 120 and should keep prices near 121.

IV. Technical / Other
I have made a few changes to the VIX Call and Put Indicator charts to improve the readability including cutting off the extreme values and changing the intervals to 0.25 from 0.5. The main take from the charts is that the current readings are nowhere near SELLs and the Puts show extremely low levels that are comparable to VIX compression as seen in early June, Aug and Sep 2018.
First, the VIX Calls are at about the avg level and show no sign of an expected pickup in volatility.

Next, the VIX Puts are at a very low level seen during early June, Aug and Sep 2018, when the SPX was in consolidation mode.
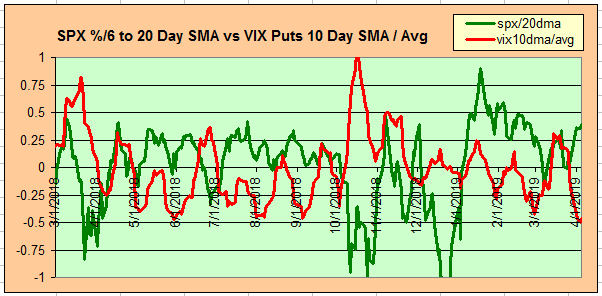
And finally, looking at the VIX Calls relative to the VIX levels, the low levels seen in early June, Aug and Sep 2018 saw sharp compression of the VIX as the SPX topped.

Conclusions. Most of the sentiment indicators are indicating that a tradeable top is near, likely equal to the SPX 100 pt drop in June 2018, but the timing is uncertain. The Hedge Ratio and VIX Put Indicators are showing that a period of low volatility consolidation is likely before any downturn. A couple of weeks ago, I discussed a "Trader Joe scenario" that could mean a mid Apr top, followed by a decline into mid May and then a summer rally - a similar timing seems likely, but without the wave count.
Weekly Trade Alert. Early summer doldrums may see a low volatility rise to SPX 2910-20 into mid Apr, then maybe a "sell in May" fakeout. Updates @mrktsignals.
Investment Diary, Indicator Primer, update 2018.03.28 Dumb Money/Smart Money Indicators
Article Index 2019 by Topic
Article Index 2018 by Topic
Article Index 2017 by Topic
Article Index 2016 by Topic
Long term forecasts
© 2019 SentimentSignals.blogspot.com
No comments:
Post a Comment