
Border wall with Mexico - no problem. Trade war with China - no problem. Let's party like it's 1999.
This week, in the Tech Indicator/Other section, I will take a closer look at the SPX ETF Indicator, comparing 2019 to 2014 when the "smart" money was not so smart.
I. Sentiment Indicators
The overall Indicator Scoreboard (INT term, outlook two to four months) bearish sentiment dropped sharply last week, now nearing the levels of the mid June 2018 top. We may be within 2-3 days of a top then drop 3-5%.

The INT view of the Short Term Indicator (VXX+VXXB $ volume and Smart Beta P/C, outlook two to four months) bearish sentiment is also near the levels of the mid June 2018 top.

Bond sentiment (TNX) is still looking like the Jun-Sep 2018 period where a three month consolidation was seen before a sharp runup in rates.

For the INT outlook with LT still negative, the gold miners (HUI) bearish sentiment remains at low levels.

While looking at the ST, it is still topping.

II. Dumb Money/Smart Money Indicators
The Risk Aversion/Risk Preference Indicator (SPX 2x ETF sentiment/NDX ETF sentiment, outlook 2 to 4 mns/wks) as a INT indicator seems to have made a rounded bottom similar to Sep-Oct of 2018 that could indicate a significant top is near.

The option-based Dumb Money/Smart Money Indicator as short/INT term (outlook 2 to 4 mns/weeks) remains at moderately low bearish levels, but this indicator did not perform well off the Oct 2014 lows.

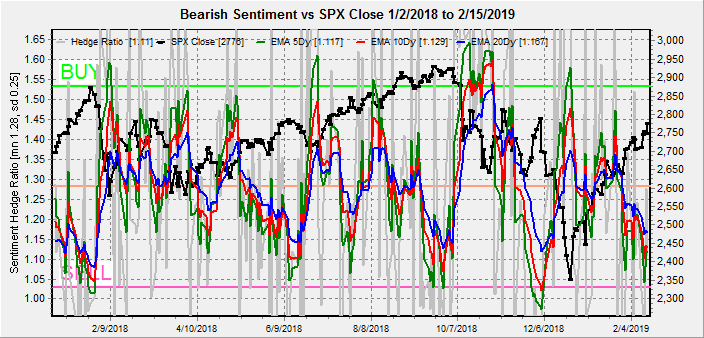
While the options Hedge Ratio that proved more accurate off the Oct 2014 bottom is nearing bearish levels similar to the Jun 2018 top.
The INT term SPX Long Term/Short Term ETFs (outlook two to four weeks) bearish sentiment remains in an unusual pattern due to neutral smart money and low bearish levels for dumb money. More in Tech/Other section.

Long term neutral, the INT term NDX Long Term/Short Term ETF Indicator (outlook two to four weeks) as the long cycle seems to follow prices, the short cycle has remained at low levels that may indicate a Dec 2014 top is near as shown in the 2014 chart.

Surprisingly, the 2014 NDX Long Term/Short Term ETF Indicator worked much better than in 2018, much like the SPX ETF Indicator in 2018. Nov 2014 sentiment is similar to Feb 2019.

III. Options Open Interest
Using Thurs close, remember that further out time frames are more likely to change over time. This week I will look out thru Feb 28.
With Fri close at SPX 2776, Tue shows falling call resistance over 2775 and is unlikely to effect prices while over 2725. May see higher prices. Light open int overall.

Wed, little put support until SPX 2665, where the calls at 2750 and 2775 are likely to be critical. A close at or below 2775 is possible.

Fri has large option OI and a decline down to SPX 2725 or even 2700 seems probable.

For Feb EOM, the open int is very large and the puts at SPX 2725 and 2750 may provide some support. The 2710 calls seem critical due to hedging while prices remain higher, but below there is little put support until 2675 and 2650. A gap fill at 2640 is possible.

IV. Technical / Other
An interesting article on ZeroHedge last week, pointed out that professional investors have been underweight equities since the Dec 2018 lows. This prompted me to compare the current SPX ETF Dumb Money/Smart Money Indicator to 2014. The conclusion was that in both periods "smart" money underperformed, probably due to the fact that market performance was driven by sentiment, not fundamentals.
For 2014, SPX ETF Dumb Money/Smart Money Indicator showed a strong BUY at the Sept 2018 top, but as seen below with the 2x and 3x ETFs, this was simply an artifact of stronger buying at the top by the "smart" money. In 2019, we are now seeing the reverse.

Looking at 2014 "dumb" money (2x) showed weak bearish levels the last half of 2014.

Looking at 2014 "smart" money (3x) was even less bearish.

Comparing 2014 "dumb" money (2x) to today, we see moderate buying (low bearish levels).

Comparing 2014 "smart" money (3x) to today, sentiment is neutral.

Weekly Trade Alert. A ST high in the SPX is expected by Wed in the 2800+ area that could drop down to 2700 or lower by EOM and may ultimately make a 38% retracement from the Dec lows. Updates @mrktsignals.
Investment Diary, Indicator Primer, update 2018.03.28 Dumb Money/Smart Money Indicators
Article Index 2018 by Topic
Article Index 2017 by Topic
Article Index 2016 by Topic
Long term forecasts
© 2019 SentimentSignals.blogspot.com
No comments:
Post a Comment