
Last week, I mentioned that the jobs number was likely skewed by seasonal adj and a couple days later Lee Adler posted that the actual jobs added was only 54k, while over 250k were added by comparison to the avg Dec numbers.
Over the next few weeks I'm expecting enough whipsaws to confuse everyone. Currently most sentiment and talking heads seem to expect clear sailing up to new highs similar to the rally off the Apr 2018 lows, but what could go wrong? China trade talks showed little progress, the Fed is confused, and heavy EPS reports start next week. A test of the SPX 50 SMA at 2630s may be all she wrote before a b-wave of Oct-Dec correction retrace to fill the Jan 4 gap at 2445, if overall earnings don't disappoint another wave up in Feb is likely, but Mar will be tough when possible China tariffs redux and Fed FOMC may still cause a full retest of the Dec lows.
I. Sentiment Indicators
The overall Indicator Scoreboard (INT term, outlook two to four months) bearish sentiment is starting to drop and is following a similar pattern to Apr 2018.

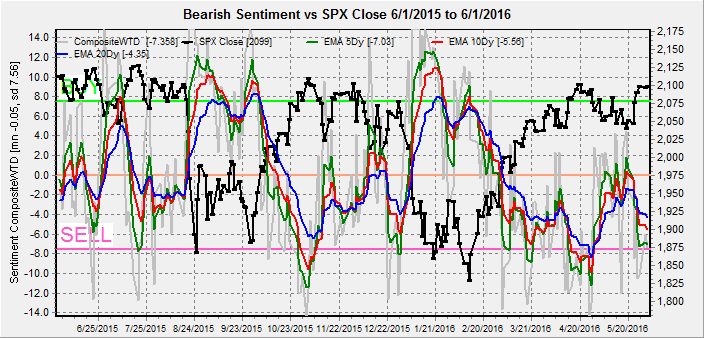
A look at 2015-16 shows that current sentiment is at similar levels to the Sep 2015 and Feb 2016 retests.
The INT view of the Short Term Indicator (VXX+VXXB $ volume and Smart Beta P/C, outlook two to four months) bearish sentiment is also following a similar pattern to Apr 2018.

Bond sentiment (TNX) is still looking like the Jun-Sep 2018 period where a three month consolidation was seen before a sharp runup in rates.

For the INT outlook with LT still negative, the gold miners (HUI) bearish sentiment may have caused a top in the HUI as rates have bottomed out, but the dollar remains a wild card, where in Jul-Aug 2018 a sharp decline in the US $ caused a spike in prices.

II. Dumb Money/Smart Money Indicators
The Risk Aversion/Risk Preference Indicator (SPX 2x ETF sentiment/NDX ETF sentiment, outlook 2 to 4 mns/wks) as a INT indicator is showing risk preference as investors are chasing the high beta (NDX) stocks expecting a Apr-Oct 2018 run up - not bullish ST for NDX.

The option-based Dumb Money/Smart Money Indicator as INT term (outlook 2 to 4 mns/weeks) is oddly exactly at neutral, but similar to Apr 2018, as both dumb and smart P/C are increasing - more volatility, but limited downside.

Comparing to 2015-16, both were close to neutral before the retests with 2015 above and 2016 below.

The INT term SPX Long Term/Short Term ETFs (outlook two to four mns) bearish sentiment remains similar to Apr-May 2018 as both dumb and smart money are buying with smart in the lead. A weak uptick last week indicates somewhat higher prices ahead before a pullback.

Comparing to 2015-16, the 2019 slightly positive sentiment is more like the Jan-Feb 2016 period before the retest, but the persistent low readings the last half of 2015 leads me to believe that it was just a B-wave of a large ABC correction from May 2015 to Feb 2016 (9 months). Thus the low readings in 2019 may also indicate a B-wave correction is occurring, and if the entire ABC takes 9 months this would put the C-wave lows in the Fall (same as the 2010-11 analog).

Long term neutral, the INT term NDX Long Term/Short Term ETF Indicator (outlook two to four mns) as the long cycle seems to follow prices, the short cycle has turned down - negative ST.

III. Options Open Interest
Using Thurs close, remember that further out time frames are more likely to change over time. This week I will look out thru Jan 18, opt exp.
First, a look at last Fri shows why the SPX was stuck between 2575 and 2600 with an upward bias.

With Fri close at SPX 2596, Mon as long as the SPX holds above 2570 there is little call resistance at higher levels. Light open int overall.

Wed is unusual as it looks like Wrongway Gartman has a $60M bet that the SPX will close below 2630, dwarfing other positions. Expect 2630 puts to pull SPX to 2630 or higher.

Fri, for optn exp including SPY with SPX PMs, holding 2625 could push SPX to 2675, but more likely close is 2605-15.

SPY also shows a likely close of 261 to 265.

IV. Technical / Other
This week I am going to take a look at the Technical Indicator Composite (NYMO + TRIN + NYAD + NYUD). Several analysts have noted that extreme overbought readings have driven the TI indicators to near record highs, indicating that another sharp pullback is around the corner. NorthmanTrader has gone as far as using the NYMO highs compared to the Jan 2009 rally off the Dec 2008 lows as an argument that another bear leg is about to begin. The TI composite also shows extremes, but looking over the past several years, four instances are comparable, Oct 2015 off the Sep retest lows, Mar 2016 off the Feb retest lows, the late Nov 2018 highs and last week off the Dec 2018 lows (see charts below). The first two occurred with high bearish sentiment and the rally continued, while for the third bearish sentiment was low and we had the Dec crash. Now, we still have high bearish sentiment, and combining with the SPX ETF DM/SM sentiment similarity to 2015-16, a continued rally is more likely.
Chart for 2015-19.

Chart for 2015-16. Closer examination also shows that the extreme overbought readings occurred at the 50% level of the rally. Comparing this to today if SPX 2347 to 2597 or 250 pts is halfway then the rally should continue to 2850ish.

Chart for 2018-19.

Weekly Trade Alert. Last weeks outlook for a move to SPX 2600 was close and next week may top out in the 2630s Wed/Thu with slightly lower prices expected by Fri. Updates @mrktsignals.
Investment Diary, Indicator Primer, update 2018.03.28 Dumb Money/Smart Money Indicators
Article Index 2018 by Topic
Article Index 2017 by Topic
Article Index 2016 by Topic
Long term forecasts
© 2019 SentimentSignals.blogspot.com
No comments:
Post a Comment