
I. Sentiment Indicators
The overall Indicator Scoreboard (INT term, outlook two to four months) bearish sentiment has declined sharply, now consistent with the Apr 2018 rebound top that was followed by a SPX 120 pt drop.
The INT view of the Short Term Indicator (VXX+VXXB $ volume and Smart Beta P/C, outlook two to four months) bearish sentiment has declined sharply, now also consistent with the Apr 2018 rebound top that was followed by a SPX 120 pt drop.

Bond sentiment (TNX) is still following the Jun-Sep 2018 period with an initial runup in rates similar to late Jun 2018, where a three month consolidation was followed by sharp runup in rates.

For the INT outlook with LT still negative, the gold miners (HUI) bearish sentiment rose sharply, but this time I expect LT sentiment to reach the 2015 levels before an inflation rally begins.

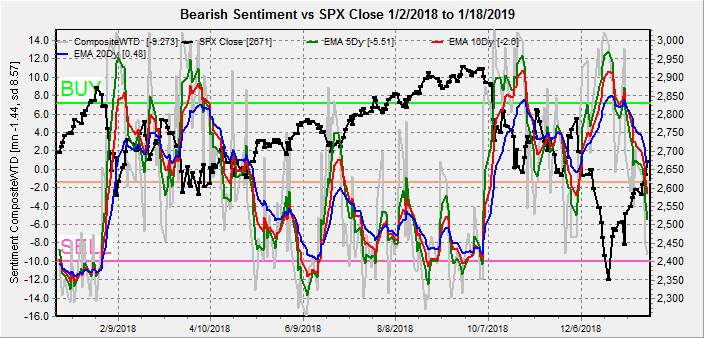
II. Dumb Money/Smart Money Indicators
The Risk Aversion/Risk Preference Indicator (SPX 2x ETF sentiment/NDX ETF sentiment, outlook 2 to 4 mns/wks) as a INT indicator has dropped sharply, warning that preference for NDX has reached the danger levels.

The option-based Dumb Money/Smart Money Indicator as INT term (outlook 2 to 4 mns/weeks) has finally moved below neutral but is well off the Apr 2018 lows, indicating another week or two of rally is likely.

The INT term SPX Long Term/Short Term ETFs (outlook two to four weeks) bearish sentiment has also moved down but is well off the Apr 2018 lows, indicating another week or two of rally is likely.

Long term neutral, the INT term NDX Long Term/Short Term ETF Indicator (outlook two to four weeks) as the long cycle seems to follow prices, the short cycle has reached the Apr 2018 top level.

III. Options Open Interest
Using Thurs close, remember that further out time frames are more likely to change over time. This week I will look out thru Jan 31 and Feb optn exp.
With Fri close at SPX 2671, Tue (MLK holiday) could move up or down, with first call resistance at 2675 then 2700 and lower support around 2625. Light open int overall.

Wed is similar with inflection pts at SPX 2625, 2650 and 2675. Remember that above call levels dynamic hedging may support prices and over 2675 there is little resistance to 2750.

Fri, has many overlaps but with current sentiment and momentum a move towards SPX 2700 seems likely with stronger resistance at 2725. Moderate open int.

For EOM, the overlaps again make interpretation difficult, but overall downward pressure is likely toward SPX 2650. Possibly a setup similar to the EOM Jan 2018.

For Feb optn exp, this one has a definite downward bias, although the open int is small, with a move down to/below SPX 2580 likely.

IV. Technical / Other
Last week, I showed a comparison of the Technical Composite (NYMO,TRIN,NYAD,NYUD) that showed overbought extreme, but with bullish implications compared to 2015 and 2016 in a rally off retest lows. This week I want to address the idea of a retest of the lows.
So I started working on this Wed, before the Thu-Fri romp over SPX 2675, but since everyone seemed to be looking for a retest of the Dec lows, I decided to look for the best indicator for the 2015-16 correction retests. Only one indicator stood out and that was a variation of the options DM/SM Indicator I call the Hedge Ratio. Both indicators are usually in sync and the DM/SM Indicator works better for short time frames, but this time they are out of sync with the Hedge Ratio still positive (Wed) while the former was stuck in neutral. A sharply declining Hedge Ratio was seen before both the 2015 and 2016 retests, so that will probably be the first sign of trouble.
The indication now is that a direct move to test the SPX 100 SMA at 2720-40 is likely before a pullback. Comparing this to the Apr 2018 rally off retest lows, the SPX rallied briefly thru the 100 SMA at 2700 before a 64% retracement of 120 pts and currently the 100 SMA is at 2732. A similar pullback would be to about SPX 2500. Note the 62% retracement of the Oct-Dec 2018 decline is SPX 2722.

For the 2015 retest, the sharp drop was about two weeks before the top and similar to today, while the 2016 retest occurred after the sharp drop.

Conclusions. Sentiment overall is pointing to pullback soon. From current levels a SPX pullback of 120 pts is consistent with sentiment, while a continued rally into the last week of Jan in the SPX 2720-40 area would likely see a 62% retrace where both would target the low SPX 2500s. Options open int seems to point to continued strength with a drop off in Feb.
Weekly Trade Alert. Next target for the SPX is probably the 62% retracement of the Oct-Dec decline or the 100 SMA 2720-40 before the EOM, but the risk exists for an immediate pullback to the low 2500s. Options open int show the potential for a move to 2720-40 before EOM, with a decline starting by EOM thru Feb optn exp or longer. Updates @mrktsignals.
Investment Diary, Indicator Primer, update 2018.03.28 Dumb Money/Smart Money Indicators
Article Index 2018 by Topic (will update soon)
Article Index 2017 by Topic
Article Index 2016 by Topic
Long term forecasts
© 2019 SentimentSignals.blogspot.com
No comments:
Post a Comment