
As I warned last week a hold for the SPX over 3300 would likely be bullish and was it as the SPX reached the exact top of my bullish option 3520-30 at 3530. As it turned out the winner made no difference as the market seemed to celebrate a "gridlock" scenario as the most likely outcome was a Dem president but a stronger GOP congress to reign in major policy changes. One thing the market seemed to miss, however, was that the stronger jobs number at 6.8% unemployment resulted in the GOP lowering their stimulus proposal to $500B or 25% of their pre-election offer.
Last week "smoked" most of the EW analyst who were looking for continuation of an ABC decline toward SPX 3000 such as Avi Gilbert and Trader Joe. Avi Gilbert even had an article on Seeking Alpha Mon AM predicting an SPX continuation to 3100. One analyst who changed their opinion mid-week and now recognizes the triangle pattern as a possibility a Pretzel Logic, who is looking for a breakout after a Trump/Biden victor is declared. My outlook for the triangle resolution is discussed in the Tech/Other section with comparison to the "rounded top" seen for the SPX in May 2015 and Germany's DAX in 2020, essentially a "twist" to the 1968-70 bear market with timing similar to 2008-09.
Sentiment is mixed this week where little change was seen from last week, even after an 8% rally. The biggest change was an increase in the hedge ratio that supports higher prices. Some new NDX indicators are discussed in the Smart Money section.
I. Sentiment Indicators
The overall Indicator Scoreboard (INT term, outlook two to four months) bearish sentiment was largely unchanged for the week, rising early in the week then falling. Still at the same level as the Jan 2020 lows, a final blowoff rally is possible.

The INT view of the Short Term Indicator (VXX $ volume and Smart Beta P/C [ETF Puts/Equity Calls], outlook two to four months) bearish sentiment continued to slowly rise, now reaching the neutral point.

The VXX $ Vol also rose modestly, reaching the neutral pt.

Bonds (TNX). Bearish sentiment in bonds is mostly unchanged as early election results saw a sharp drop in TNX to 0.75% Wed, but by Fri closed at 0.82%.

For the INT outlook with LT still negative, the gold miners (HUI) bearish sentiment is mostly unchanged as prices moved higher, especially Thur after Wed rate decline.

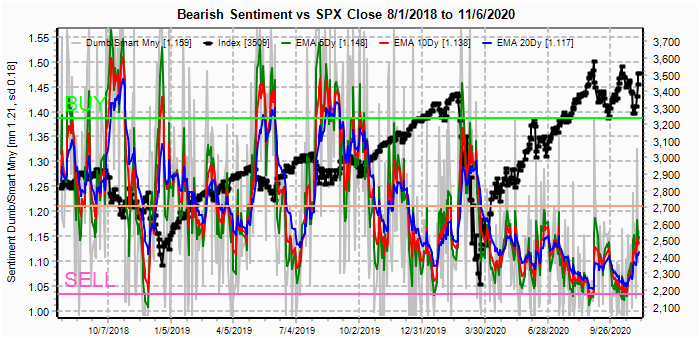
II. Dumb Money/Smart Money Indicators
The option-based Dumb Money/Smart Money Indicator as short/INT term (outlook 2 to 4 mns/weeks) bearish sentiment rose only slightly.
And the sister options Hedge Ratio bearish sentiment jumped sharply, now reaching te level of the Jan 2020 lows. This will likely contain any downside and add fuel to upside momentum.

The INT term SPX Long Term (2x/DM) ETFs (outlook two to four weeks) bearish sentiment rose slightly, and will probably limit LT gains.

I have been somewhat frustrated with the lack of clarity from using the ETFs, but developing the VIX Buy/Sell indicator gave me a few ideas. First, I realized that the QQQ OI charts were underestimating call buying because most of the NDX interest was in the FAMNGS + Tesla, so that investors were buying equity calls not QQQ calls. So for a new indicator I decided to look at the QLD (2x QQQ) vs Equity calls. The result indicates that when Equity calls are high, QQQ OI puts are less effective due to higher Equity call resistance, but when Equity calls are low QQQ OI puts show stronger support. Note chart titles should say NDX Close. Next week I will show similar charts for the SPX.
For now, I am calling this the QQQ term structure and the sentiment is positive.

The one problem was the lack of a Sell for Dec 2018, so I found the using the ETF calls (prior research showed that ETF options were 70% SPY and QQQ) with the QLD. The large ETF call volume in Dec 2018 showed lack of hedging, producing a Sell, while now we see a high level of hedging, consistent with the Hedge Ratio. I am calling is the QQQ/NDX hedge ratio and it remains positive.

III. Options Open Interest
Using Thur closing OI, remember that further out time frames are more likely to change over time, and that closing prices are more likely to be effected. Delta hedging may occur as reinforcement, negative when put support is broken or positive when call resistance is exceeded. This week I will look out thru Nov 13. No GDX/TLT charts this week.
With Fri close at SPX 3509, options OI for Mon are very small below SPX 3500, but a move over 3510 has little call resistance until 3550. Could see a move higher given higher overall hedging.

Wed has somewhat larger put support at SPX 3465 and 3475, but little call resistance until 3600. Limited downside and unknown upside.

For Fri could be an interesting Fri 13th. Fairly large OI with call resistance over SPX 3470.and no unhedged put support until 3350 and 3330 hedged also. Possible ST spike to 3300+.

For Nov optn exp PMs, small OI, but looks negatively biased to SPX 3375 for now. Put rollover is likely to increase support if decline next week

Using the GDX as a gold miner proxy closing at 41.4, close was slightly over first call monthly resistance at 41.
Currently the TLT is 159.4 with the TNX at 0.82%.
IV. Technical / Other
This week I want to take a closer look at what appears to be a triangle formation today in the SPX and what it could mean bigger picture. Below are two instances of similar patterns that may be a guideline to what to expect. The first chart is current and shows resistance at SPX 3525-30 and support around 3250. The second is the SPX from May 2015 and represents what I call a "sloppy" chart as TL are exceeded numerous times, while the third is the DAX for 2020 that is a "neat" chart where TL are not broken. I think the sloppy charts are due to "algo" controlled US markets, where TL are broken to the upside to get shorts to cover and downside to get longs to bail.
I expect a "sloppy" chart this time and it may show up early next week with a false breakout to SPX 3540-50 before a "sell the news" decline" that may test the SPX 3300 level, but stay above support. SPX for May 2015 also has somewhat lower MACD than the DAX similar to today. One thing that is common to both outcomes is that a top may be 6-8 weeks away, either late Dec or early Jan.

A similar pattern for the SPX was seen prior to the May 2015 top, which I call a "rounded" top, or a possible H&S.

A similar pattern was seen in Germany's DAX earlier this year.

One last chart which has been puzzling me for a few weeks now is the high volume of VIX puts. Typically volume of P&C go up & down together, mostly high on large declines. This may be a precoursor to a collapse in the VIX below 20 before a larger decline.

Conclusions. As I write this AP has declared Biden to be the winner, but I am not sure if that is considered official as there may still be recounts and Trump has vowed to fight all the way to the Supreme court. I really liked the way the census collected their data this year with a secret code being mailed out to each person that could be used to fill out the data online. It's too bad they can't make voting that simple.
My best quess
is that the markets are entering what I call a rounded top and may actually
reach my original upside target of SPX 3600-50 by EOY, Comparisons to the
SPX for 2015 and the DAX for 2020 indicate that a top maybe 6 to 8 weeks away.
While the SPX recently had a 7% decline, the DAX declined 15% due to rampant
outbreaks of the c-virus causing partial shutdowns. The US "flu season"
doesn't start until mid-Dec even though we are nearing record daily numbers.
It's interesting that the current outbreak in the US is mostly in the "red"
states where Trump had several large rallies to celebrate that we have "turned
the corner". Were these rallies actually "super spreader" events? A
top in the broader markets may occur when the outbreak spreads to the more
populated areas of the east and west coasts.
Weekly Trade Alert. A spike over the triangle resistance Mon/Tue
may be a setup for a pop & drop or "sell the news" event to fill the SPX cash
gap at 3310-30 possibly by EOW or early next week. Updates @mrktsignals.
Investment Diary,
Indicator Primer,
update 2020.02.07 Data Mining Indicators,
update 2019.04.27 Stock Buybacks,
update 2018.03.28 Dumb Money/Smart Money Indicators
No comments:
Post a Comment