
Last week I was looking for a top in the SPX 3620-70 area before a pullback of 3-5% into the EOM as low as 3450-500, and Mon gapped up, topping near 3630 with a low just above 3540 or -2.5%. Sentiment is mixed with Tech Indicators (Tech/Other) showing extreme overbought and overall bearishness declining, but moderate hedging seems to be supporting the market for now. I am getting a deja vu feeling to Dec 2015 and Dec 2007 where most analysts were predicting strong 1st halfs the next year, but both started with Jan-Feb declines of 15%+/-.
The Tech/Other section includes an update of equity puts&calls that shows an uptick in speculation, the Tech indicator composite that shows extreme complacency, and a LT indicator, the NYUPV/NYDNV, that shows an almost identical setup to 2008.
I. Sentiment Indicators
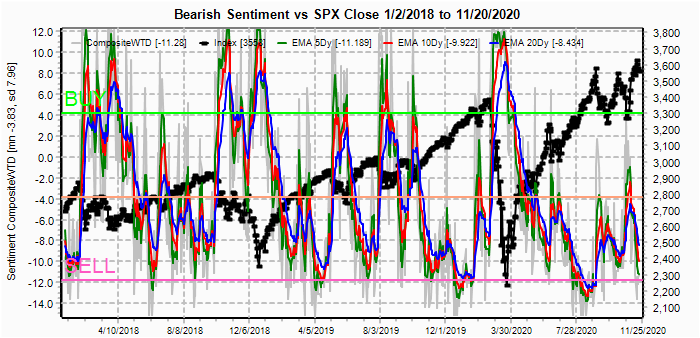
The overall Indicator Scoreboard (INT term, outlook two to four months) bearish sentiment fell sharply last week, even with market weakness, and is now lower than the Feb 2020 top.
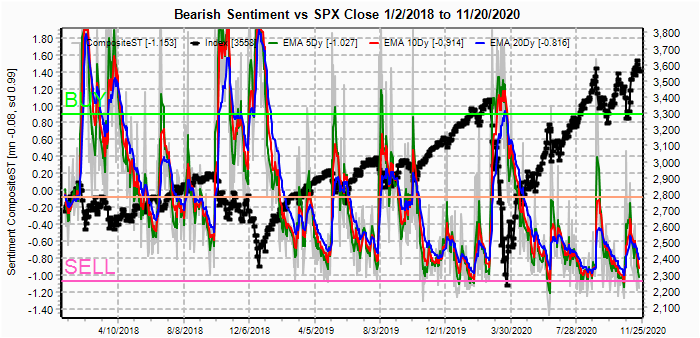
The INT view of the Short Term Indicator (VXX $ volume and Smart Beta P/C [ETF Puts/Equity Calls], outlook two to four months) bearish sentiment also turned down sharply and now equals the Feb 2020 top.
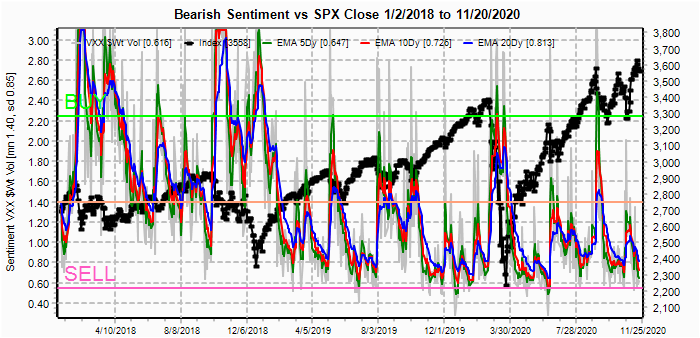
The VXX $ Vol also fell, now matching the Feb and Oct 2020 tops.
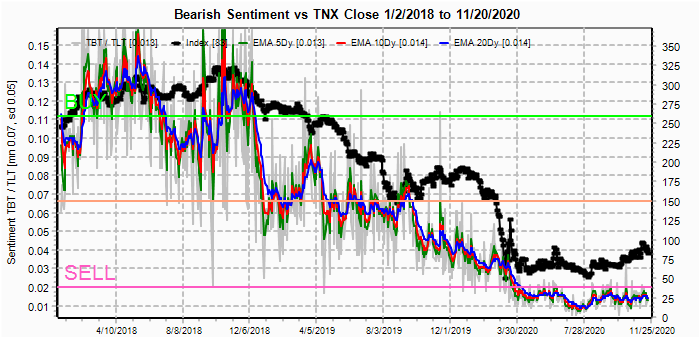
Bonds (TNX). Bearish sentiment in bonds remains virtually unchanged as rates retreated modestly.
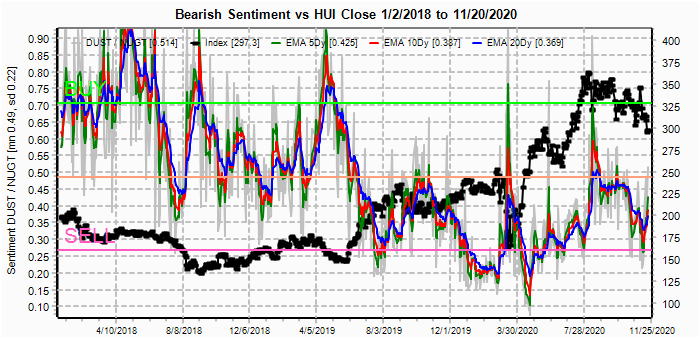
For the INT outlook with LT still negative, the gold miners (HUI) bearish sentiment remains near the recent lows, even with an 8% pullback to the lows of the week. Gold bugs seem to be clinging to the hopes of a "bull flag" similar o Jun-July, but GDX options OI is showing little put support, and a breakdown below the lower TL could result in a selling panic down to 250ish.
II. Dumb Money/Smart Money Indicators
The option-based Dumb Money/Smart Money Indicator as short/INT term (outlook 2 to 4 mns/weeks) bearish sentiment is hovering near the Feb 2020 level.

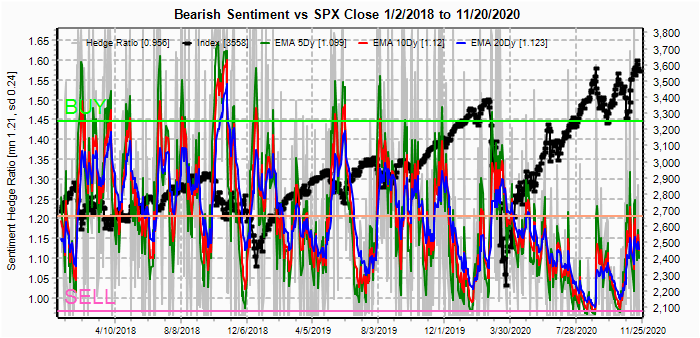
And the sister options Hedge Ratio bearish sentiment on a ST basis is somewhat elevated compared to other sentiment, but INT term is the lowest of the past three years .
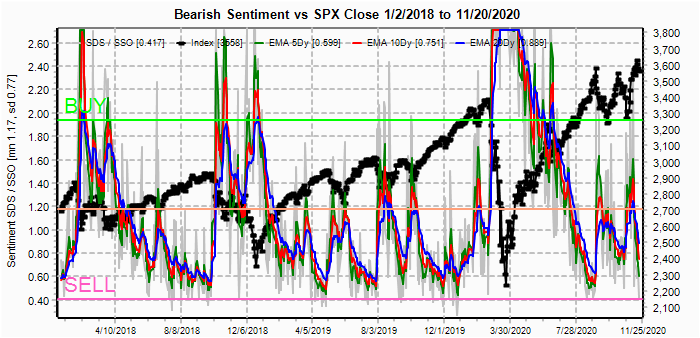
The INT term SPX Long Term (2x/DM) ETFs (outlook two to four weeks) bearish sentiment has fallen sharply to below the Feb 2020 top. Data mining - term structure SSO/CPCRev calls, and hedge ratio SSO /ETF calls are nearing levels of Sept top.
The INT term NDX Long Term (2x/DM) ETFs (outlook two to four weeks) bearish sentiment is similar to the Sept top. Data mining - term structure QLD/Equity calls, and hedge ratio QLD /ETF calls are nearing levels of Sept top.

III. Options Open Interest
Using Thur closing OI, remember that further out time frames are more likely to change over time, and that closing prices are more likely to be effected. Delta hedging may occur as reinforcement, negative when put support is broken or positive when call resistance is exceeded. This week I will look out thru Nov 30. Also, this week includes a look at the GDX for Dec exp.
For last Fri close there was a sharp pickup in put OI with the SPX 3558 closing right at support.

With Fri close at SPX 3558, options OI for Mon has the potential to drop to the 3525 level, but puts in the 3540-50 level are likely to push prices up to towards the 3550 level by the close.

Wed has somewhat larger OI, especially at SPX 3400, where SPX has small put support up to 3525 and larger support at 3450 then 3400. A decline to near 3450 is possible with negative momentum.

For Fri SPX OI is moderate, but a lot of overlap between 3400 and 3600 creates a confusing pattern, but 3450-3500 seems most likely.

With the EOM Nov 30, the following Mon has the largest OI with strong put support up to 3575. This could either contribute to a positive bias to next week (lows in the 3500-3550 area), or be a setup for a strong post holiday rebound on surprise news (perhaps FDA emergency approval of a c-virus vaccine or stronger than expt BF sales). Either way a push to 3575-3600 is likely.

For the QQQ (NDX/41, 11.9k=290), closing at 290.4, there is strong put support at 290 and 285. Weak ETF and data mining indicators may lessen support.

Using the GDX as a gold miner proxy closing at 35.9, there is small put support up ro 37 with strong call resistance at 40. With low ETF sentiment, there is a real risk of panic selling if the 34-5 area breaks down.

Currently the TLT is 161.5 with the TNX at 0.83%.
IV. Technical / Other
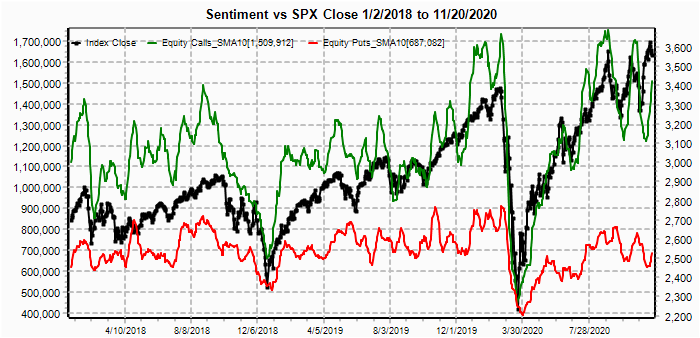
The equity puts and calls saw a pickup in speculative call volume (FAAMNGs) as news of increasing spread of the c-virus has propped up the tech sector.
The Tech Indicator composite (NYMO+TRIN+NYAD+NYUD) is now showing extreme complacency, especially with last week's decline.

While the LT chart for the NYSE adv/dec volume (NYUPV/NYDNV) would typically be a positive indicator compared to the last 5 to 7 years, but looking back to 2005, we see a long basing period where the first breakout is buying exhaustion, virtually identical to the 2007 topping period.

Conclusions. Bearish sentiment overall has reached extreme low levels where an INT top can occur at any time. Whether it's the election or the virus or possibly something external that is the "reason" for a large decline is hard to tell. I have been looking at two periods, 2015 for the INT term and 2008 for the LT as in the volume chart above. It's interesting that Nov 30 was also a Mon in 2015 and a look at a chart might indicate one possibility, where we see a top the first week of Dec (vaccine news?), a decline into mid-month (electoral college vote?) and a couple of attempted rallies before a Jan-Feb plunge of 15%+/-.

Weekly Trade Alert. There may be a continuation of the decline into next week that could drop below SPX 3500, but there may be another retest of the SPX 3620-70 area as early as the first week of Dec. News of the approval of a vaccine by the FDA, possibly Nov 30 could provide a more important selling oppty. Updates @mrktsignals.
Investment Diary, Indicator Primer,
update 2020.02.07 Data Mining Indicators,
update 2019.04.27 Stock Buybacks,
update 2018.03.28 Dumb Money/Smart Money Indicators
No comments:
Post a Comment