
After watching some of Trump's campaign rallies last week with MAGA signs in the background, I realized that the Dems missed a great oppty to come up with their own slogan. To wit, MASA or "Make America Safe Again" - increase safety from c-virus with free masks and testing, from racial violence with more police oversight and "in progress", from wildfires consuming western states with increased environmental oversight, and from devastating hurricanes in the southeast by reducing long term effects of climate change. Recently I have been watching reruns of a TV show called Salem from 2014-15, where it turns out the real witches are the Puritans who cover up there own evil deeds by accusing everyone else of being a witch, and the more I watch, the more the Puritans remind me of the GOP. End of rant.
Last week, I warned of an impending top and as has been seen too often my outlook for a decline over the next couple of weeks was compressed into several days. The excessive bullishness expressed by the equity put/call indicators matching the Feb 2020 top was the likely cause. As posted on Twitter before Fri open, the decline to retest the Sept lows was also following the Oct-Dec 2018 analog for Nov where a decline to retest the Oct lows was followed by a retest of the Nov highs before a final plunge. The Nov low retest was about 1% above the Oct lows, hence my target of about SPX 3225 (act 3234), while a retest of the highs was 1% lower (about 3520-30 now). The Dec 2018 decline was 140% of the Oct decline (350 vs 250 SPX pts) and today that would be about 550 pts, or below 3000, vs the Sept 380 pt decline.
Obviously, the results of the election and more importantly the markets reaction will determine the markets short term path and I don't think it is as simple as a Trump win means a rally, while a Biden win means a decline. For instance, a Biden win may mean more stimulus vs a Trump win. so the results may be the opposite of what is expected. MW had a good read on economic outlook vs POTUS. I am close to 50/50 between the Oct-Dec 2018 analog and the continuation to SPX 3130 as part of the 1968-70 analog.
This week I am lengthening the indicator timeline back to mid-2018 to include the late 2018 sentiment. The Tech/Other section includes the SPX charts for 2018 and today for comparison, as well as an update of the VIX Buy/Sell Indicator as now included in the regular graphics program.
I. Sentiment Indicators
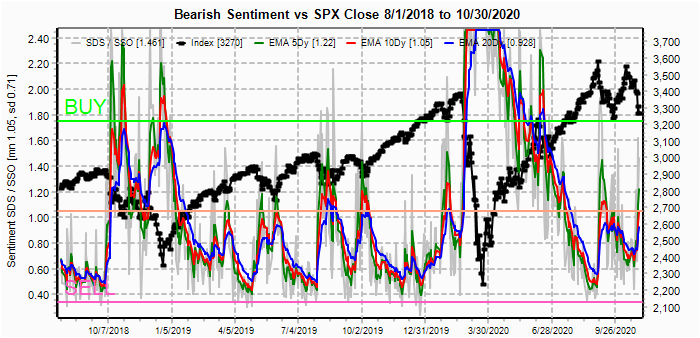
The overall Indicator Scoreboard (INT term, outlook two to four months) bearish sentiment has risen only modestly about to the level of the Jan 2020 decline, preceding a 200 pt rally before thr Mar plunge.

The INT view of the Short Term Indicator (VXX $ volume and Smart Beta P/C [ETF Puts/Equity Calls], outlook two to four months) bearish sentiment has been even weaker, mainly due to little change in the SB P/C.

The VXX $ Vol rose back to neutral, again matching the level at the Jan lows.

Bonds (TNX). Bearish sentiment in bonds is virtually unchanged. Even though rates pulled back as expected Mon-Wed, the Thur auction of 7 year T-bonds went poorly resulting in a Thur-Fri jump in rates from 0.79 to 0.86%. One of the reasons I am expecting a bear market in equities is that the last 4 years under MAGA the deficit rose from 20T to 27T with lower tax rates, trade wars and the "not a problem" pandemic. As a result the US has huge borrowing needs with the public having less to invest and foreign gov'ts not interested in buying US bonds. The result will be higher rates forcing the Fed to become more hawkish to calm the bond market.

For the INT outlook with LT still negative, the gold miners (HUI) bearish sentiment is little changed as PM investors, like POTUS, have their heads in the sand. Lower prices are likely.

II. Dumb Money/Smart Money Indicators
The option-based Dumb Money/Smart Money Indicator as short/INT term (outlook 2 to 4 mns/weeks) bearish sentiment has barely budged with even the ST EMAs unable to reach the neutral pt since the end of Mar. To me this looks like a bear market setup with extreme LT complacency, likely due to faith in the Fed.

And the sister options Hedge Ratio bearish sentiment has risen more sharply, indicating slightly more hedging than what was seen at the Sept lows, supporting a Nov 2018 type rally back to the low SPX 3500s.

The INT term SPX Long Term (2x/DM) ETFs (outlook two to four weeks) bearish sentiment is also lagging the Sept decline, showing little LT bearishness.
III. Options Open Interest
Using Thur closing OI, remember that further out time frames are more likely to change over time, and that closing prices are more likely to be effected. Delta hedging may occur as reinforcement, negative when put support is broken or positive when call resistance is exceeded. This week I will look out thru Nov 6. Also, this week includes a look at the GDX & TLT for Nov exp.
With Fri close at SPX 3270, options OI for Mon has large put support around 3200 with the potenial for a move over the 3325 puts if 3300 is exceeded. 3350 to 3400 are mostly straddles.

Wed has somewhat larger OI where SPX call resustance at 3310 and 3335 will likely pressure prices downward. There is only modest put support at 3325 and if broken, larger support is at 3125. With overall low P/C, a washout tp SPX 3125 is possible with a negative election surprise.

For Fri w/jobs report, the huge call OI at SPX 3500 makes the chart unreadable, so the second chart reduces the 3500 calls by 25k. Now we can see small put support up to 3375 with larger support around 3200. If a washout does occur Wed, it is likely to reverse to at least 3200 by Fri. The big question is whether the 3500 calls are smart money as they do seem to represent a hedge fund position and also seem to support the Nov 2018 analog. If Wed remains over 3300, that is a possibility.


For the QQQ (NDX/41, 11k=268), closing at 169.4, put suppoort made no differnce with Thur disappointing iPhone news from AAPL. Perhaps CCP is telling the 600M Chinese to make China great again by buying Hauwei, not Apple products. Should see support, but not willing to commit.

Using the GDX as a gold miner proxy closing at 37.5, two weeks ago a move below 39 showed little put support to lower prices, but we now have strong put support at 37 & 38 that should support prices.

Currently the TLT is 157.6 with the TNX at 0.86%, normally I don't show GDX and TLT together, but Nov optn exp is so unusual that I thought it was necessary. First, no one has asked, but I consider TLT puts as a contrary, or smart money, position due to the excessively bullish ETF indicator. With last weeks sharp turn around, the huge (100k) puts at 148 & 149, probably indicates that a huge stimulus package approval after the election will push rates much higher The last time the TLT was 148 (late Feb), the TNX was 1.45%.

IV. Technical / Other
First, I want to reiterate a couple of items mentioned in the updates that deserve repeating. I had misintrepreted the Oct-Dec 2018 analog which showed a retest of the lows (about 1% higher) shown below. Links to full size charts - 2018, 2020.

Next, I decided to incorporate the VIX Buy/Sell indicator (avg of SKEW and VXV/VIX) into my main graphics package. Using the SPX as a base the "Sell" leads a top by 2 to 4 months, but the "Buy" as shown is very accurate and the strength of the signal approximates the strength of the rally. Not showing a "Buy" yet for the SPX.

Using the VIX as a base, the "Buy" was at or near the low for the VIX and leads a sharp spike by 2 to 4 months. The "Sell" occurred at or near a top in the VIX and has not occurred yet. Note the VIX MAs have reached the level of the Fri and Dec 2018 lows, but the VIX term structure remains near .95 and should fall to around .80 before a top.

Conclusions. I did not like the BTFD rally at the end of the day Fri as it showed lack of capitulation. Looking closely at the 2018 analog, the low on Nov 23 (Fri) was near the low of the day on low volume making it more likely that last weeks high volume low will be retested on lower volume if not beaten. Sentiment remains mixed, where a drop toward 3100 or a rally toward 3500 seems equally likely. The outlook for bonds is looking increasingly bearish.
Weekly Trade Alert. An SPX move of 200 pts seems possible, but in either direction. A retest of the lows on lower volume Mon/Tue would probably support the 2018 analog. Updates @mrktsignals.
Investment Diary, Indicator Primer,
update 2020.02.07 Data Mining Indicators,
update 2019.04.27 Stock Buybacks,
update 2018.03.28 Dumb Money/Smart Money Indicators
No comments:
Post a Comment