
Last week was somewhat of a bust as the SPX OI puts at 3425 proved to be support but the 3525 level did not provide the expected positive gamma effect. On Tue update I warned that rhetoric from DC was not supportive of a ST stimulus approval and the 3400 was possible and after testing the 3410 level Wed the SPX bounced, closing down about 20 for the week.
The sideways/up grind the last half of the week was enough to finally get the vol players moving to the sidelines and it is one of the last factors I was looking for as a top indicator. A continuation of this trend thru the end of next week will likely provide a setup for another 10% drop after the election. As I mentioned last week, most are expecting the Pres cycle to provide a rally thru the EOY, much like the positive "seasonal effect" expected in Dec 2018, so this may be a contrarian's dream setup. Some are expecting an even sharper decline such as Avi Gilbert, who is expecting SPX at sub-3000 by the end of Nov, but I see this as unlikely unless the Dems takeover both the Pres and Senate. The SPX option OI includes a post-election look at sentiment for Nov 4 and it shows a drop to the low 3300s is possible.
This week in the Tech/Other section is an update of the data mining indicators for the Equity P/C that show extremes last seen right before the Sept 10% selloff.
As an aside, I have to make a comment about the alleged scandal concerning Hunter Biden's laptop. Am I the only one computer savvy enough to know that emails are not stored on your personal computer? Whether desktop or laptop, your emails are stored on your email providers server (ie, google for gmail) and the only way to gain access is to hack into your account (illegal without a warrant). Hillary, on the other hand, was a gov't employee using gov't email account on gov't server, therefore had no privacy rights.
I. Sentiment Indicators
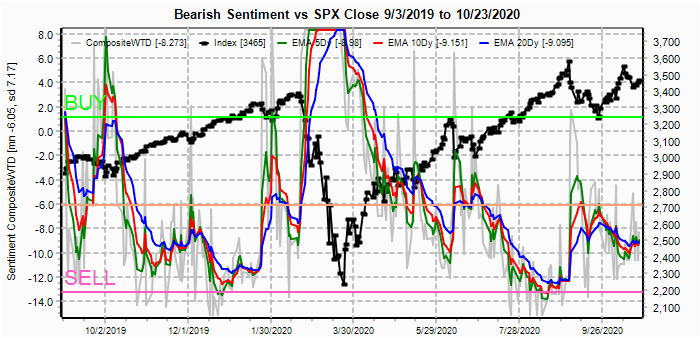
The overall Indicator Scoreboard (INT term, outlook two to four months) bearish sentiment is mostly unchanged for the week and remains similar to what was seen at the Feb 2020 top.
The INT view of the Short Term Indicator (VXX $ volume and Smart Beta P/C [ETF Puts/Equity Calls], outlook two to four months) bearish sentiment has started a sharp drop matching the Aug 2020 top (due to VXX $ Vol below).
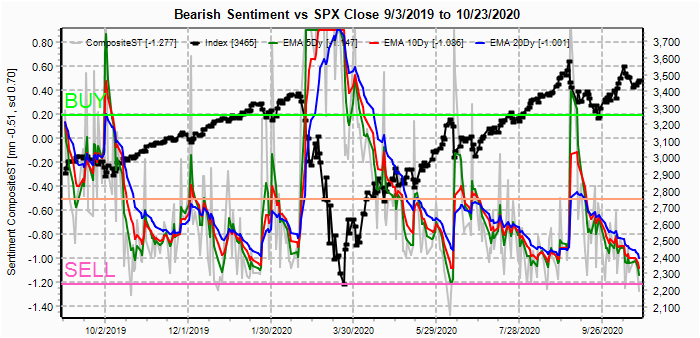
The VXX $ Vol dropped sharply Th/Fri as the vol players seem to be finally giving up. The past couple of weeks vol hedging was one of the few things supporting current price levels, but now that support is quickly eroding.

Bonds (TNX). Bearish sentiment in bonds surprisingly turned down, even though rates rose steadily thru the week from 0.74% to 0.87% at the high. This indicates higher rates ahead.

For the INT outlook with LT still negative, the gold miners (HUI) bearish sentiment fell sharply last week even as the HUI has fallen about 7% the last week and a half. Now approaching a SELL, lower prices are likely, especially with the lack of put support as shown in the GDX options OI last week if below $39.

II. Dumb Money/Smart Money Indicators
The option-based Dumb Money/Smart Money Indicator as short/INT term (outlook 2 to 4 mns/weeks) bearish sentiment rose last week, surprisingly similar to what was seen just prior to the Feb and Aug 2020 tops.

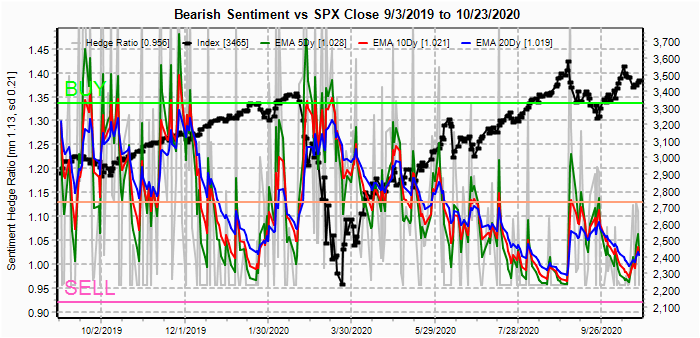
And the sister options Hedge Ratio bearish sentiment also showed a modest uptick.
III. Options Open Interest
Using Thur closing OI, remember that further out time frames are more likely to change over time, and that closing prices are more likely to be effected. Delta hedging may occur as reinforcement, negative when put support is broken or positive when call resistance is exceeded. This week I will look out thru Oct 30. Also, this week includes a look post election SPX for Nov 4, and at the TLT for Oct 30.
With Fri close at SPX 3465, options OI for Mon only shows very weak put support over 3400 and strong call resistance above 3500. Likely more range bound moves.

Wed has small OI where SPX has little call resistance up to 3500 and recent patterns of put rollover may provide enough support to move prices toward 3500.

For Fri Oct EOM, SPX has large OI, but again little resistance up to 3500, so put rollover may support a move to 3500.

For Post election Wed Nov 4, negative gamma with large call OI at 3310 and 3335 may indicate the start of a sharp selloff beginning early Nov with the low 3300s possible by Nov 4.

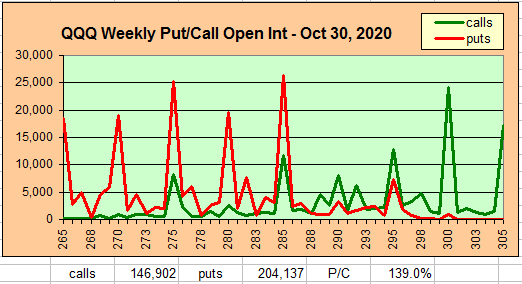
For the QQQ (NDX/41, 11.5k=280), closing at 284.7, indicates strong put support at 285 and little call resistance until 290 or 2% higher. This is the main reason I see a positive bias next week for the SPX.
Using the GDX as a gold miner proxy closing at 38.8, even as I warned that 40-41 had proven to be strong resistance and that there was little put support below 39.
Currently the TLT is 158 with the TNX at 0.84%, for the week the TNX rose from a low of 0.75% on Mon to a high of 0.87% on Fri AM. The TLT 158.5 puts rose from a low of $.20 Mon to a high Fri AM of $1.60 or 8x. Even though the P/C is high, there are no "big money" bets and put support extends up to 161.5. Expect rates to fall w/TNX back to 0.8% or lower and TLT 160+.

IV. Technical / Other
This week I want to look at the data mining indicators for the Equity P/C. One of the things I discovered was at important tops, most recently Aug 2020, there is a presence of both high speculation as measured by the equity call to equity P/C spread (dumb money) and also a high level of hedging as the equity put to equity P/C spread (smart money).
Below is a chart of the equity puts and calls which shows the level of puts
and calls just below that of the Aug high.

Here is the equity call to equity P/C spread where the spread is just above
that of the Aug highs and the double dip is very similar to what was seen at the
Feb 2020 high.
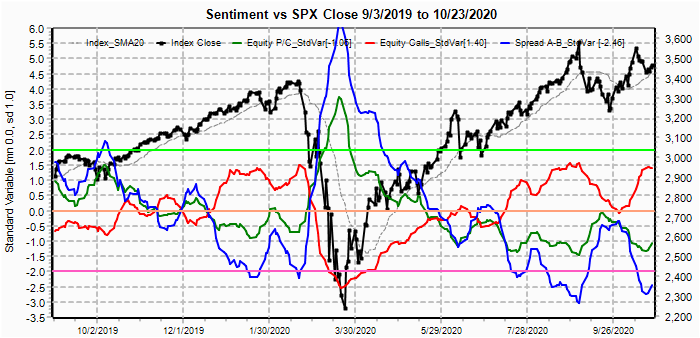
While below, the equity put to equity P/C spread is just above that of the Aug
highs and the double dip is very similar to what was seen at the Feb 2020 high.

Conclusions. The next few days are likely to see an important top. Current ST indicators are pointing to the possibility of another 10% correction by comparison to Aug 2020, but could end up being part of a larger decline. It is possible that a Dem sweep of Pres and Senate cold result in a sharper selloff due to Biden's plan on raising the cap gains tax, otherwise the prospect of a viable vaccine by late Nov and or additional fiscal stimulus may limit the immediate downside. My preference is the beginning of a 1-2 year bear market similar to late 1969-72 discussed in the LT outlook for 2018 which started with a series of 10% corrections.
Weekly Trade Alert. The SPX appears to be in an IHS pattern from 3550 which I doubt will complete, but with positive QQQ OI may push to an upside target of 3510 by late next week or possibly Nov 2/3. Continuation of current sentiment trends would then support another 10% decline. With Sept decline at SPX 380 pts, a C=A decline would be to SPX 3130, the 200 day SMA. Updates @mrktsignals.
Investment Diary, Indicator Primer,
update 2020.02.07 Data Mining Indicators,
update 2019.04.27 Stock Buybacks,
update 2018.03.28 Dumb Money/Smart Money Indicators
On your comment about email, if you use a client application like outlook to access your email, the data can be stored on local pc.
ReplyDelete