
Entering the Bermuda Triangle.
Last week ended up being dominated by the Trump wildcards as warned in .the WE conclusion. First, a Sunday announcement of an early release from the hospital on Mon sent markets soaring (to SPX 3430 by Tue) as Trump claimed an easy victory over Covid-10 then promised that every American could get the same treatment he did for free. But Tue mid-afternoon he rejected the idea of a stimulus approval, sending the SPX down 50 pts in minutes. Then after an O/N selloff that sent the SPX (FX) down to the 3340s, his position changed, promising a big stimulus, causing the market to soar the rest of the week past the 62% retracement of the Sept decline (around 3450).
Bearish sentiment is now entering the equivalent of the Bermuda Triangle where there is an increasing uncertainty going forward. By some measures comparing sentiment to early 2020, there are a number of similarities with momentum lows at ATH followed by higher lows in sentiment with a blowoff rally. However, some such as the VXX $ Vol, SKEW to VIX term structure and several data mining indicators, such as equity puts to equity PC just don't line up just yet.
The most likely outcome, as indicated by the SPX options OI, is a short but sharp decline in the SPX of about 3-5% to get the bears to reload, probably due to delay of any stimulus package until after the election, then a continuation of the rally in Nov. The TLT OI also seems to support this as most of the puts projecting higher rates were exercised last week.
I. Sentiment Indicators
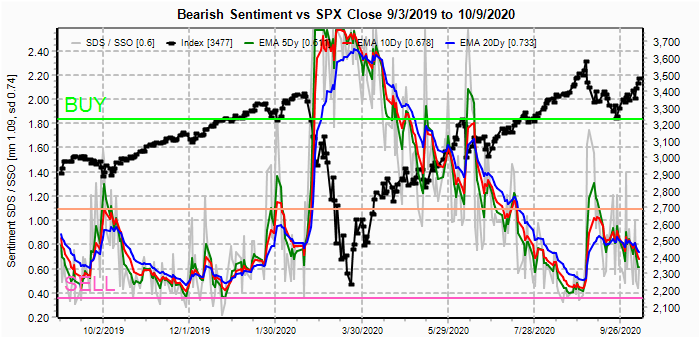
The overall Indicator Scoreboard (INT term, outlook two to four months) bearish sentiment has declined to the levels of the Feb 2020 top and the second Sept leg down. Pulback of 3-5% possible.

The INT view of the Short Term Indicator (VXX $ volume and Smart Beta P/C [ETF Puts/Equity Calls], outlook two to four months) bearish sentiment has rallied more strongly (due to VXX $ Vol below).has also retreated to the levels of the Feb 2020 top.

The VXX $ Vol has stubbornly refused to even approach.the levels seen before the Mar 2020 decline. Any decline likely to be short term.

Bonds (TNX). Bearish sentiment in bonds saw very little change with the recent jump in rates from 0.6 to 0.8%.

For the INT outlook with LT still negative, the gold miners (HUI) bearish sentiment remains unchanged as a sharp drop in the US$ late in the week saved PMs from new ST lows..

II. Dumb Money/Smart Money Indicators
The option-based Dumb Money/Smart Money Indicator as short/INT term (outlook 2 to 4 mns/weeks) bearish sentiment is approaching the Aug lows. As with each of the following indcators compared to early 2020, the ATH retest saw lower bearish sentiment than the first. SPX should be close to a top.

And the sister options Hedge Ratio bearish sentiment is lagging somewhat but compared to sentiment early in 2020 is approaching the levels of the Feb top.

The INT term SPX Long Term (2x/DM) ETFs (outlook two to four weeks) bearish sentiment is about the same level as Feb 2020.
III. Options Open Interest
Using Thur closing OI, remember that further out time frames are more likely to change over time, and that closing prices are more likely to be effected. Delta hedging may occur as reinforcement, negative when put support is broken or positive when call resistance is exceeded. This week I will look out thru Oct 16. Also, this week includes a look at the TLT for Oct exp.
With Fri close at SPX 3477, options OI for Mon is definitely in the positive delta hedging territory where SPX shows call resistance over 3400 and support at 3300 and 3350, but as pointed out in las weeks updates a high P/C may indicate enough bearishness to offset the effect of low OI, but PC at 115% is lower than last Wed 150% and Fri 125%.

Wed has very small OI where SPX shows call resistance over 3400 and support at 3300.

For Fri PM, OI is modest (AM is mostly large hedges) but there are about 15k SPX calls between 3300 and 3450 that may cause negative delta hedging (gamma) compared to the 30k for Sept 30). Definitely a possible start to a 3-5% pullback if stimulus news is disappointing late in the week.

For EOM, anywhere between SPX 3200 and 3500 is possible, but high PC at 122% indicates a positive bias.

For the QQQ (NDX/41, 11.5k=280) closing at 285.7, PC is neutral at 103%, so the call resistance at 285 is likey to provide a ceiling with pressure down toward the calls at 280.

Using the GDX as a gold miner proxy closing at 40.8, GDX was pushed back to resistance a 40.5 from Thurs 39 level due to sharp drop in US$..
Currently the TLT is 160 with the TNX at 0.775%. After spending most of the last two weeks in the 0.65% area, on Mon the TNX jumped up to the .8% area (TLT 159). Two weeks ago with TLT at 165, OI showed a large contrarian position with 80k puts at 160.5 and 90k at 155. At last weeks lows at 159, most of the 160 and 1/3 of the 155 puts were exercised. The 160s went from a low of about .50 to over 2. The reduction in put OI is a strong indication that rates may have temporarily topped, ie, no stimulus is expected.

IV. Technical / Other
One of the reasons that interest rates may be rising is shown by the CITI Inflation Surprise Indexes. Released monthly by Citi Banks Research Dept, it shows the highest inflation surprise seen in several years for the US. Likely much of this is due to a combination of tariffs on imports from China and a lower US$ since many other countries remain in deflation.

Conclusions. This on again, off again stimulus hope rally is beginning to remind me of Nov 2018 where after an 11%+ decline in Oct, Nov was spent in a month-long flat with a maximum retracement of 74% (equal to the 3488 level today). In Nov 2018 the hope was for a US-China trade agreement as Trump would change his position almost weekky as the SPX went up on a positive tweet and down on negative tweets. It finally took an additional 15% decline in Dec to provide an incentive for both sides to come to an agreement.
Weekly Trade Alert. As pointed out above, we could be close to a relapse with limited upside and downside targets probably in the SPX mid-3300s (possible retest O/N FX at 3340). SPX EOM OI indicates a rally is likely to follow. Updates @mrktsignals.
Investment Diary, Indicator Primer,
update 2020.02.07 Data Mining Indicators,
update 2019.04.27 Stock Buybacks,
update 2018.03.28 Dumb Money/Smart Money Indicators
No comments:
Post a Comment