
Looking at the SPX since March, we have seen a monthly pattern that shows a rally into the mid-month followed by a decline thru the end of month. This may be due to the monthly withdrawal of liquidity by the Fed thru the unwinding of QE by the reduction of the Fed's balance sheet. Trump's tax cuts may be offsetting the effects on the economy, especially the corporate sector. Starting the end of July, QE reduction increases from $30 to $40 billion a month and up to $50 billion in Sept, but Trump is not proposing additional tax cuts until later in the Fall. This leaves EOM Jul - Sep as a potential bumpy period where additional stimulus withdrawal is not offset by a sugar fix. Add potential trade war blowups and it could be a high risk period.
I. Sentiment Indicators
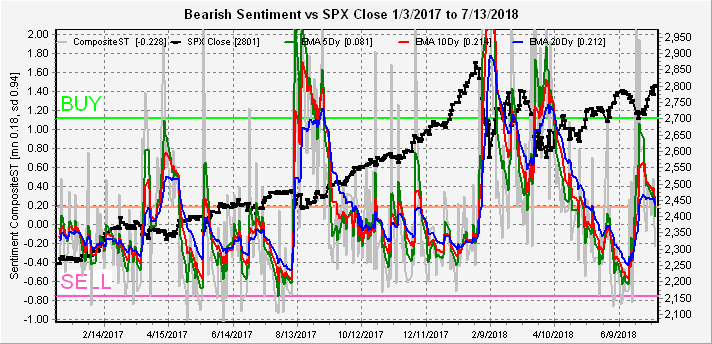
The overall Indicator Scoreboard (INT term, outlook two to four months) continued to fall last week, dropping below the mean, but continued SPX consolidation with an upward bias is likely before sentiment drops to at least the mid-May levels and before a sizable SPX pullback. The DJIA is still in a "triangle" with the Feb and May high TL showing 25,250 as a possible ST top. This could mean SPX 2820-30 before a pullback to 2750ish.

The INT view of the Short Term Indicator (VXX $ volume and Smart Beta P/C, outlook two to four months) is in a similar position to the Indicator Scoreboard.
Bearish bond sentiment (TNX) continued to show intra week spikes lower in bond sentiment which I am wondering if there is an effect of the Thurs weekly bond auction. In any case, a continued sentiment decline may not see rates for the TNX fall much lower than 2.7% before reaching a SELL.

For the INT outlook with LT still negative, the gold miners (HUI) rally was short-lived as bearish sentiment fell, pulling prices down.

II. Dumb Money/Smart Money Indicators
The Risk Aversion/Risk Preference Indicator (SPX 2x ETF sentiment/NDX ETF sentiment, outlook 2 to 4 days/hours) as a very ST indicator continues to remain in low/neutral territory, and may be warning of a weakening of the out performance by the NDX.

The option-based Dumb Money/Smart Money Indicator as short/INT term (outlook 2 to 4 days/weeks) continues to hang around the neutral area.

The INT term SPX Long Term/Short Term ETFs (outlook two to four weeks) fell sharply last week with the ST EMAs reaching neutral, but not low enough to expect a pullback soon.

While the SPX 2x ETF sentiment continued to fall below the neutral area and is nearing the mid-May level that saw an SPX pullback of 60 pts.

The INT term NDX Long Term/Short Term ETF Indicator (outlook two to four weeks) fell sharply last week as the NDX made new highs. Comparing sentiment to Jun-Jul of 2017. the NDX could be nearing a consolidation period.

While the NDX 2x ETF sentiment remains elevated, it has dropped by an equivalent amount to the Feb-Mar rally, so may need a cooling off period. An INT top does not seem to be in sight.

III. Options Open Interest
Last Mon did see the potential delta hedging by SPX puts over 2775 that carried to near the 2800 resistance, and surprisingly the strength carried over into Fri where strong call resistance at 2800 was also overcome.
Using Thurs close, remember that further out time frames are more likely to change over time. Next Mon has small open int, but the setup is similar to Fri where a hold over SPX 2795 can remain between 2800 and 2825, but a move below 2795 could drop to 2780.

For Wed, the main difference is that large put support drops to 2765 with large call resistance at 2825.

For Fri, I usually don't post the SPX AM monthlies because they are usually hedged (overlap), but this month is different. Here we see huge unhedged calls at SPX 2800 and partially unhedged calls at 2775 that are likely to push prices to the 2775 level or lower.

Fri weekly PMs are much the same where the expected close is SPX 2775.

The next large open positions are the following Fri and EOM. The 27th shows large SPX call resistance over 2775 and modest put support at 2750. Expected range 2750-75.

For the 31st, the configuration is similar to the 27th but with larger open int. Additional calls at 2740 and 2750 could act to push prices as low as 2725. Expected range 2725-75.

Conclusions. Regular sentiment (INT) is nearing the levels prior to a small pullback similar to May, but DM/SM sentiment (very ST) is still neutral. However, SPX options open int is showing a pullback could start by Fri and continue thru the EOM that could carry down to the SPX 2750 level or lower. Optimally the market will continue to hold over SPX 2800 and may approach 2820-30 by Wed/Thur allowing the DM/SM Indicators to generate a SELL before a pullback begins.
Weekly Trade Alert. Will be looking for shorting oppty at SPX 2800+ depending on confirmation by DM/SM Indicators.. Updates @mrktsignals.
Investment Diary, Indicator Primer, update 2018.03.28 Dumb Money/Smart Money Indicators
Article Index 2018 by Topic
Article Index 2017 by Topic
Article Index 2016 by Topic
Long term forecasts
© 2018 SentimentSignals.blogspot.com
No comments:
Post a Comment