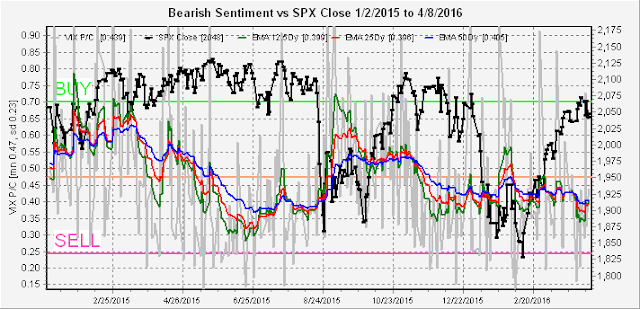
Last week I made an official sell signal while pointing out that the top may not be in yet. Basically I am expecting sideways chop (up or down) into at least mid-May. Today I want to show why I am cautious on the short side. Given the sharp declines of last Aug and this Jan, the bears seemed to have focused on the volatility products as their hedging weapons of choice.
So to illustrate this I will show four volatility measures that I track: VXX $ volume (adj) as an intermediate term indicator, VXX/XIV short/long ETF measure as long term, VIX put/call as short term, and the SKEW as long term. Also, I have finished adding options for longer period EMAs as multiples of the original 5, 10 and 20 day periods, so will be trying those for illustration.
First the VXX $ volume (adjusted for S&P volume). This is probably the most reliable single indicator I use and currently the pattern more closely resembles the Feb 2015 period than the November 2015 period leading me to slightly favor an upward chop with a target of SPX 2100. The VXX buyers/bears need to get whacked a few times before giving up.
The following is a two year chart using 12, 25 and 50 day EMAs that shows no significant declines when readings are as neutral as they are today.
As a long term sentiment measure, the VXX/XIV ratio and typically shows extremes at the end of long term moves.
This is seen more clearly in the chart going back to 2013, the earliest reliable data. Here several cycle are evident. The pattern from mid-2013 almost looks like an inverted head and shoulder pattern with double left shoulders. It reminds me of what I would expect if Avi Gilbert's scenario came true where a correction in the SPX to the 1700's was followed by a several year rally to 2500.
The VIX P/C is mainly useful in identifying short term tops as low put/call ratios determined by large number of calls is often indicative of "smart money" hedging positions through buying of VIX calls. This measure is slightly negative and longer period in the same range would be similar to Nov-Dec of 2105.
The last volatility measure is the SKEW as measured by out of the money option premiums (mostly puts). I prefer to think of this as a "smart money" indicator where option premiums are set by the writers, but overall this does not show much short term timing effectiveness. Here the axes are reversed since high values are bearish. The high values from Sept to Dec 2015 did correctly forecast the Jan selloff.
Longer term shows the effectiveness of the SKEW in prior periods which makes the recent low readings somewhat worrisome from the bearish perspective. Current readings are similar to early 2015.
As a final chart, borrowed from another blogger, is an analog to 1957 which may be an alternative if the SPX retests its 2015 highs. Here we had a year long trading range followed by a very weak Jan, a rally to mid-year, then a 19% decline. As a final alternative, I give this one a probability of 20%, but with a breakout over SPX 2085, move to 40%.
Conclusion. For the indicator roundup this week the readings improved to -5, up from -8 last week, with one positive, 6 negative and nine neutral. Notably ETF P/C, NYMO, and SSO/SDS moved to neutral with SKEW moving to positive. Composite#1 moved to neutral as it includes SKEW. A rally for options expiration seems likely and oil may be strong with another OPEC production meeting next weekend. A move to SPX 2070-80 will likely provide a good shorting opportunity as OPEC news is likely to be sold. Probably the best opportunity for a 3-5% correction since late Feb, potential target roughly SPX 2000.


No comments:
Post a Comment