Long Term Views
Early 2015 I wanted to see if there were fundamental reasons to support the seeming high valuation of the stock market and developed a valuation approach, based on the dividend discount model using the 10 year T-bond as the discount rate. Full article. The results going back to 1980 were that as the economy slowed and interest rates dropped by 50%, the fair value of the DJIA doubled. The forecast for mid-2016 were a GDP growth of about 0.5%, the 10 year bond near 1% and the fair value of the DJIA at 18,514. Extracted below:
- My most likely scenario. The recent rise in the dollar and collapse of the Euro has certainly clarified what I see as “no way out”. It is likely that the US economy will enter row five the first half of next year as the economy slows down and 10-yr rates approach 1%. However, by the second half of next year the collapse in the Euro should turnaround the EU economy, possibly sharply. As to US stocks, low growth will push valuations up to DJIA 18514. I expect the price levels to increase by the change in valuation or to about 27000 by the end of next year. A small “snap back” may be seen in the traditional May-Oct selloff period in 2015.
As you can see, the second half of my prediction calls for a melt up starting the second half 2016. This was before I even thought of developing a sentiment model, but now my long term views are somewhat more tempered (more like the view of Jeremy Grantham at GMO) and I hope to update my long term forecast by the Fall.
Short Term Views
Bearish sentiment has been dropping like a rock, led by the put/call ratios as shown by my CPC Revised (less VIX puts and calls), whereas money flow indicators as shown by the SDS/SSO and SPXU/UPRO are only now approaching the mean sentiment levels. The two most reliable indicators for the short term of 2-4 weeks based on the March 23 statistical tests are the Smart Beta P/C (ETF puts/Equity calls) and the VXX $ Volume
I have combined these into a short term composite that is moderately below the mean. The major tell so far has been the VIX P/C which usually drops to 30% at tops as smart money loads up on VIX calls and is now in the 50-60% range.
The overall Indicator Scoreboard (composite of 16 indicators) has now dropped to its lowest level of the year, although the speed of the decline leaves some room for the longer term EMAs to catch up through a consolidation before a decline.
The CPC Revised put/call ratio has dropped to an extremely low level essentially in a mirror image of the January rise indicating the possibility of a significant top for the SPX, both in price and time. Comparing this behavior to the Jan - Feb bottom, a higher high can still be achieved after a correction with sentiment at less extreme levels.
Looking at the money flow indicators (SPX 2x and 3x ETF ratios), the more conservative (2x) SDS/SSO ratio saw a very unusual jump in bearish sentiment almost matching the levels of the Aug and Jan declines, which turned out to be a warning of a sharp rally as fund flow reversed. Sentiment has now reached a neutral level.
The more aggressive (3x) SPXU/UPRO had a much less extreme reaction to the BREXIT scare and has reversed the run up in bearish sentiment to match the level of the July 2015 top.
The Smart Beta P/C (ETF puts/Equity calls) showed a similar extreme in bearishness to the SDS/SSO ratio which made me wonder about its effectiveness but did prevent me from being prematurely bearish. This indicator is now possibly several days away from reaching the levels of the July 2015 top.
The VXX $ Volume has now reached the level of several short term tops over the past year. Interestingly there was a pickup in volume on Friday with about one-third of the volume after hours when the Turkey coup attempt was announced. Unwinding these trades will probably provide upward price pressure for early next week.
Combining the last two indicators with the best short term return correlations (2-4 weeks), I will now be using a short term composite (CompositeST) as shown below. For future posts I will be mostly referring to the two composites.
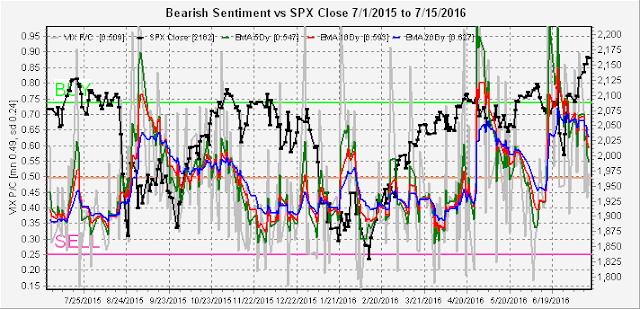
Finally, the VIX P/C, which does not track well statistically due to its bipolar nature (high call buying at tops by smart money and at bottoms by dumb money). Over the past year high P/C has resulted in choppy markets, both up and down, while low P/C has preceded all of the sharp declines. So, I would not expect any sharp declines just yet.
Conclusion. A top of some magnitude is approaching. For those of you that like historical analogs, the period from July 2007 to Oct 2007 is probably the closest to my favorite scenario. Here, we saw a slight ATH in July compared to 2000 for the SPX, a 10% decline in August, then a rally to new ATHs in Oct. Due to the election, a win by the Democrats would be seen as a win for the status quo and may drag the top into mid-Nov. Many of the sentiment indicators show that longer term EMAs have not reached the sell level and with the high VIX P/C, we are likely to see choppy trading until that happens.
Weekly trade alert. Due to the proximity to a top, I am willing to short at the SPX 2165 level with a stop at 2180 and a target of 2080. With the failed coup in Turkey, we could see a pop on Mon/Tue then a short term falloff. Due to the choppy nature expected, I may use trailing stops. Updates at @mrktsignals.


No comments:
Post a Comment