Last week, I mentioned that options week volatility looked like accumulation and that I expected higher prices ahead. Now, I am beginning to feel that the "bots" are front-running my trades. Two weeks ago I gave a weekly target of SPX 2070/80 and it was met on Monday, and last week my targets of SPX 2085 by the first week of June and 2100 by mid-June were both taken out. As I will show this week, the rapid advance has been at the cost of capitulation by the bears, so that a top may be only a couple weeks away. Just remember that a top does not mean an immediate crash, as the May 2015 top did not see a significant decline until late August.
Let's start with the intermediate-term Indicator Scoreboard of the weighted avg of 16 indicators. The overall pattern appears similar to the early 2015 period where an initial "SELL" was met by a decline that included a sharp rise in bearishness then a sharp rally that caused bearishness to again fall sharply (Feb-Mar). If the similarities continue we could see a topping period (distribution) extend another 4 or 5 months.
In April, I pointed out that even though the Students Trifecta had given a sell signal at SPX 2080 an immediate decline was unlikey "Why I am a Cautious Bear" due to too much volatility hedging. This week I want to revisit the volatility measures starting with the intermediate signal of the VXX $ Volume. After generating a "BUY" at the Jan and Feb lows, the indicator remained neutral for the second half of the rally, then moved into the bottom half of the range near the April high and has remained there. When this indicator was below the mean over most of 2015, no significant breakouts were seen, so it is doubtful if we see one now.
The longer-term VXX/XIV ratio was at a "BUY" as late as early April, but has fallen quite dramatically since and the current position is close to the position of the May and Nov 2015 tops.
Conclusion. As late as last week, I indicated that I was expecting a "summer swoon" with an SPX decline down to the mid-1700s possibly due to election (Trump factor) jitters. More recently I have come up with a second scenario which I slightly favor although still rate as 50/50. The second scenario is that of a "hunchback" head and shoulder pattern from early 2015 with a long left shoulder the first half of 2015 and a slightly lower head (DJIA, SPX but not NDX) defined by the Aug 2015 and Jan 2016 declines. This may be determined by election outcomes with a Trump victory seen as short term pain and long term gain whereas a Clinton victory would be short term gain and long term pain.
Weekly trade alert. None at this time. Too early to short and going long at this time is like picking up quarters in front of a steamroller.
Last week's trade alert stated a shorting target from a high of SPX 2070/80, but I was expecting it at the end of the week not on Mon so I missed that one. My expectation was the opposite of what happened, but I got the whipsaw right. What we saw were declines every day after Mon that looked like the bottom was going to drop out, only to see miraculous recoveries by the end of day. What actually happened is more likely accumulation pointing to higher prices ahead, while I was expecting distribution pointing to a top.
We have three big events over the next month that will determine were the stock market goes. The first week of June is the job report and should be weak given the rising initial claims (see the 1-yr trend at research.stlouisfed.org/fred2/series/IC4WSA). A weak jobs report raises questions about a Fed rate hike so expect a positive response (my target is SPX 2085). Next on June 15th the Fed announcement where a "No" vote will likely see the SPX up to 2100. Finally, the Brexit vote on June 23rd where a "No" vote will likely see the SPX up to the previous ATH at 2135. Different outcomes will likely not be positive.
Sentiment is virtually unchanged for the week both intermediate (2 to 6 months) and short term (2 to 6 weeks).
A spike in bearishness in the middle of the week faded by the end of the week.
Conclusion. The likely accumulation phase has forced me to raise my outlook for making it to the ATH of SPX 2135 from 40% after exceeding 2085 (from April 9) to 50% dependent on the events listed above. If ATHs are achieved, election jitters will take front stage and could bring about the "summer swoon" mentioned March 5.
Weekly trade alert. A new very short indicator I am investigating to help during periods like last week indicates a short-term pullback is likely (possible gap fill at SPX 2040) before a rally, likely to SPX 2085 the first week of June. Look for a pullback in SPX to go long at 2040 with a stop at 2030 and a target of 2085. Updates @mrktsignals.
In last weeks post, I expected a 1-2 day rally to start the week with an upside target of SPX 2075/80 that would be followed by a 40-50 pt decline to SPX 2030/35. Overall not a bad call with a high just below 2085 and a low of about 2043. We may still see the target low early next week, but high put/call ratios and low SKEW point to higher prices by the end of the week.
Looking at the sentiment indicators, starting with the the intermediate Indicator Scoreboard, levels have risen to the same area as the Mar and Nov 2015 lows, supporting a short term rally.
Looking at the short term Indicator Scoreboard, also supports this view.
The differences between the put/call ratios (CPC Revised) and volatility (VXX $ volume) continue and currently indicate that the rally is likely to be short-lived. With put/call ratios risk-on,
but with volatility remaining in the risk-off mode.
Conclusion. I had expected a larger increase in bearish volatility sentiment, but the stubbornly low readings so far have me looking for more of an early Dec 2015 whipsaw than a Nov 2015 type rally.
Weekly trade alert. My actual trading last week was sub par, since my entry was placed too low (2075) rather than the SPX gap at 2082/3 that I saw Monday and then I got stopped out at 2060 Thurs when I was expecting a wash out and set a stop before leaving to run a couple of errands. To make trading ideas more flexible, I set up a Twitter account with username mrktsignals, where I will post trade updates, etc during the week. Next week, I will look to short a rally to SPX 2070/80, expecting a sharper decline to the SPX 2000/20 area after options exp week.
Thanks to all who have followed me through the development process and hopefully understand the assumptions so that no further explanation is necessary.
The sentiment picture this week is mixed with an interesting dichotomy. First looking at the intermediate Indicator Scoreboard, there has been some improvement (higher bearish sentiment), but comparing the current pullback to those of Mar and Nov of 2015 I would expect the 5 day EMA to reach 0 and the 10 day to reach the mean before a bottom.
Looking at the shorter term Indicator Scoreboard (3,5, and 10 day EMA), the 3 day is expected to reach the BUY level before a short term bottom is in.
Closer examination of the indicator components short term shows an interesting twist between the put/call ratios (CPC Revised) and volatility (VXX $ volume). The put/call ratios are very close to generating a BUY, but notice that spikes tend to occur a few days before tops/bottoms and much of the rally resulting from high put/call ratios occurs during options expiration week.
The volatility measure, however, peaks and troughs much closer to actual bottoms and tops. After giving a sell the end of April, the initial decline caused a spike in sentiment but has since moved back closer to a SELL even as put/call ratios continued to rise.
Conclusions. The most likely outcome comparing put/call ratios and volatility is more downside this coming week with a sharp rally to follow option expiration week. Given the positive follow through to the Friday jobs number, a 1-2 day rally to SPX 2075/80 appears likely before a sharp decline to SPX 2020/30 or lower to cause a spike in volatility and set up a later rally.
Weekly trade alert. Short SPX at 2075 if reached, stop at 2085, target 2035 for 4/1 R/R.
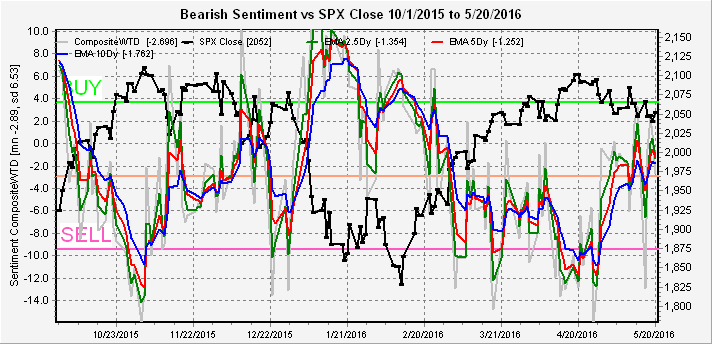
My timing model that is, not necessarily the stock market. The final form took a little twist from what I expected last week when I decided to use the correlation approach to construct a weighted average of the sixteen indicators with the highest correlation to expected returns as a graphical Indicator Scoreboard with a range of +16 to -16 based on correlation weightings. I replaced the low correlation VIX P/C and SKEW with the SPX short/long ETF pairs to end up with the following: Equity P/C, ETF P/C, SPX P/C, CPCRev P/C, Smart Beta P/C, BPSPX/CPCE, VXV/VIX, VXX $Wt Vol, SPXA50R/150, TRIN/BPSPX, SDS/SSO, SPXU/UPRO, NYMO, NYAD+NYUD. I posted a preview at TCs site here Wed before the open that turned out to be prescient since it showed a sell level similar to the Feb and Nov 2015 tops. The current chart with 5, 10 and 20 day EMAs is shown below.

The results were a little different than I expected in that the mean is -3, but this is recalculated over the period of the graph to show outliers at +/- 1 StdDev as Buy/Sell signals with weaker signals in between. So the actual mean is not important and seems to be a result of long periods of low bearish sentiment offset by short periods of extremely high bearish sentiment.
Rather than looking for longer term indicators, I decided to set up a short term composite using indicators with the highest short term correlations discussed last week and have come with this for now.
The setup looks very similar to Nov of 2015 with a rapid rise in bearish sentiment over the last few days. Continued volatility over the next few days could very well set up a buy spike for May option exp before a larger decline.