The last few weeks, I have pointing out that most sharp declines over the last year and a half have happened with low VIX P/C averages, but last week was the first sign of a change in trend from high levels with two days of .32 and .27. The EMAs are still fairly high but a continued downtrend could reach a sell level over the next week or two. Usually a .30 to .35 level is required for a sharp pullback.
Last week saw a 4 for 1 reverse split in the VXX, and the extraordinarily low volume over the last two weeks may be in part due to anticipation of the split. The same behavior occurred a few months ago with the reverse split of the gold miner's ETF DUST. Theoretically, there should be no difference in $ trading volume, but for the VXX the $ volume was 2X after the split compared to before the split. So I am applying an algorithm to the price pattern to smooth the data, and I need another week of data to fine tune the results. As a result, this week I will rely on other indicators.
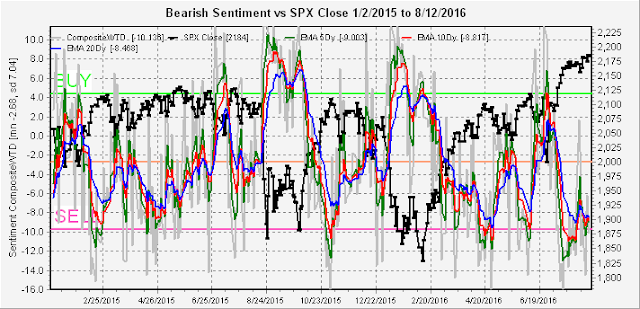
First taking a look at the overall Indicator Scoreboard (wtd composite), the levels of bearishness are consistent with a topping pattern, but also similar to the first half of 2015.
Another composite that I haven't looked at for a while, the Students Trifecta (VIX term structure, TRIN, and overbought/oversold indicator) is at a lower level than the first half of 2015, but the last time at this level in April only produced a 70 point drop in the SPX.
One of the money flow indicators, the SPXU/UPRO ETF ratio, that has produced reliable short term calls when the 5 day EMA reaches the SELL level is now indicating a SELL. The SDS/SSO ratio has reached levels only seen over the last 18 months at the Feb and Nov 2015 tops.
The last indicator the SmartBeta P/C is somewhat less ominous and is still consistent with the early 2015 topping pattern.
Conclusion. Larger price swings and higher volatility seem likely, but do not rule out a general upward trend into the election. One of the things that I see looking at the bigger picture is that a number of asset classes, including gold, stocks and bonds, seem to be topping together with oil already having broken down. Perhaps this means that the FED will become more serious about normalizing rates, at least after the election, providing headwinds for all assets.
Weekly trading alert. The SKEW is a little high at 132 to support much of a rally during expiration week, but I am reluctant to short unless the VIX P/C drops further. Last week's call eked out a small gain, short SPX at 2185, stopped at 2175. Updates or changes at @mrktsignals.


No comments:
Post a Comment