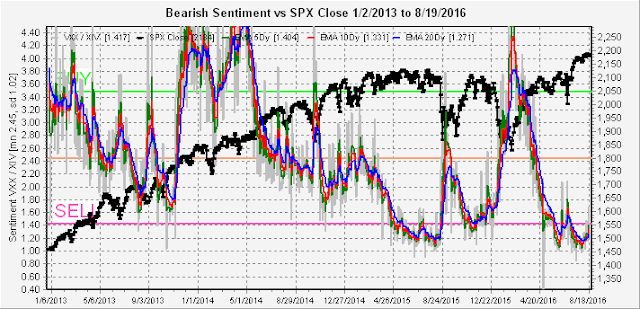
Over the last few weeks, I have pointed out that low bearish sentiment indicated that some type of top was forming, but comparing the markets to 2015, possibilities included the first half of 2015, June thru July, or Nov thru Dec. More and more, sentiment is becoming similar to the first half of 2015. Most recently, the VIX has been trading in a very narrow band historically, but in early 2015 this continued for four months.
Jumping to the overall Indicator Scoreboard, a lower volatility equivalent of Mar thru April 2015 seems to be occurring.
The Short Term Indicator (VXX $ volume and Smart Beta PC) has also been locked in a tight range similar to Mar thru April 2015.
Looking at the other indicators, the VIX P/C has leveled off around 0.5 and is neutral, one of the most reliable, the Smart Beta P/C continues to decline, but not at the SELL level yet. The SKEW is somewhat worrisome having reached the low 130s, but the end of 2015 saw this level for three months before the Jan selloff. The most worrisome immediately is the money flow indicator or the SPXU/UPRO which remains at the low levels of last week.
Conclusion. It is very possible at this point that a pullback in the SPX of 50 to 100 points occurs before a likely Oct-Nov rally. A possible top around 2200 occurring around the Jackson Hole financial summit could be followed by a pullback to test the May 2015 high at 2135.
Weekly Trade Alert. Short SPX around 2200 +/- 2 or 3 pts. Stop 2215. Target 2160 for now. VIX P/C is still too high to expect a lot of volatility.
Appendix. Last week, I mentioned that the reverse split in the VXX resulted in some unusually low volume readings prior to the split so a smoothing algorithm was applied to smooth out the volume. The first chart is the VXX $ volume for 2015 and 2016 with sentiment bottoming at normal levels (compare to early 2015).
The second chart is of the VXX/XIV from 2013 that shows bottoming sentiment similar to mid-2015.


No comments:
Post a Comment