For several weeks I have been looking for at least an intermediate term top around mid-May and next week is it. Previously, I thought a moderate push over SPX 2400 was possible, but we are now running out of time given current sentiment. Next week could see a push up to 2405, but I will be shorting SPX 2400 if not breached early in the week.
Bearish sentiment has continued to fall even as prices retreated last week. Looking first at the overall Indicator Scoreboard, bearish sentiment has almost reached the official SELL region, lower than it was in the July and Dec 2015 periods.
The Short Term Indicator (VXX $ volume and Smart Beta P/C) with intermediate EMAs reached the SELL level again after a short bounce early in the week.
Next, I want to look at the Short Term Indicator components for a clearer picture of what to expect. First, the VXX $ volume has been very low now for several months similar to the mid-2015 period, which may indicate a spike in volatility is near.
Second, the Smart Beta P/C (ETF puts/equity calls) has been one of the most reliable indicators, remaining at warning levels since the first of the year, but refusing to decline to the SELL level. The last two weeks have seen a breakdown from that range with more decline likely before a SELL is reached. One scenario that seems to fit the two components is a short, but sharp drop down to the SPX 2320-50 area, possibly by early June, then a rally back to 2400, possibly thru EOM June, then a 7-8% correction down to 2200 by late Sept.
Moving on to bonds (TNX), as rates have risen and are now consolidating in the 2.3-2.4% area, bearish sentiment for bonds continues to fall indicating that higher rates are likely ahead at some time.
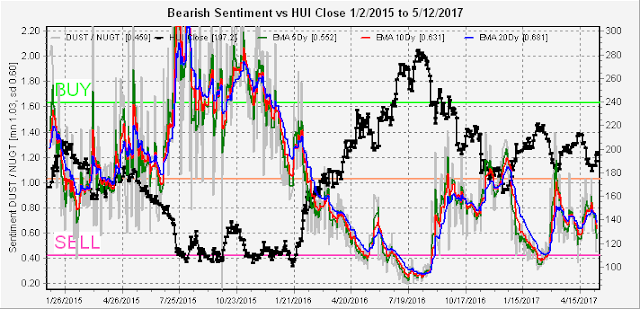
Finally with gold stocks (HUI), bearish sentiment has fallen sharply with the most recent rally. I want to inspect this more closely using a shorter term chart.
Using shorter term EMAs from Jan 2016, one can see that a continued rally towards the 210 level, possibly as a safe haven if stocks decline, is likely to set up a SELL with a decline at least as strong as the Feb decline and maybe more given the longer term view.
Conclusion. Stocks appear to be struggling, so next week I am looking for a high in the range of 2398-2405 if not exceeded by Wed. Intraday for clues I watch CBOE intraday put/call here, as you can see very low AM but higher in PM supported strong close, as well as VXX real time $ volume, which dropped to 40% of avg Wed before the Thur flush, then more than doubled Thur with about half in late trading.
Weekly Trade Alert. One by one the indices seem to be rolling over with the DJTA leading the way, followed by the BKX that is pulling the DJIA down, so that last weeks high by the NDX and SPX looks like a non-confirmation. Tough making a call here, but I think a top may be in by Wed between SPX 2398-2405. If P/Cs are weak market may not hold up thru Friday. Tenatively, Short 2398-2405, Stop 2420, Target 2320-50. Updates @mrktsignals.
Article Index 2017 by Topic
Article Index 2016 by Topic
© 2017 SentimentSignals.blogspot.com


I agree with your scenario. Market looks to sell off to 2340 by May 27th. Then Rally over the next 2-3weeks around June 21, then correct into September
ReplyDeleteNext will be a low probably on the 19th
ReplyDeleteGreat update as always Arthur. And I too agree that a correction in September is very likely.
ReplyDeleteAwesome analysis & thank you!..."a top may be in by Wed between SPX 2398-2405"....Since we reached that target today, do you see any sell off this week earlier then previously projected? Thank you in advance for your input.
ReplyDelete