Surprisingly sentiment is relatively unchanged for the week although the SPY was finally able to overcome the 250 level last week. Two weeks ago in the quarterly preview this level was identified as critical to mark the beginning of the "meltup" phase. Longer term, I am getting a deja vu feeling to Q4 of 2015 when after surviving October, most of the EW analysts turned super bullish expecting the SPX to reach 2300 to 2400 early in 2016, while I was warning of a 10% correction as early as Nov.
I. Sentiment Indicators
The overall Indicator Scoreboard continued its sideways dance as the bears are probably pinning their last hopes on scary Oct.
The Short Term Indicator (VXX $ volume and Smart Beta P/C) rose very slightly even as the markets made an upside breakout, the perfect scenario for climbing the wall of worry.
The VXX $ volume continues its dance around the mean. With its $ vol averaging $.9B, a drop of about 30% is required for an equivalent level to late 2015. This means the current price of $39-40 needs to fall to $27-8 or vol at 22M needs to fall to 15M or some combination of both.
Moving on to bonds (TNX) bearish sentiment has started to move up short term, but the longer term outlook remains bearish for bonds.
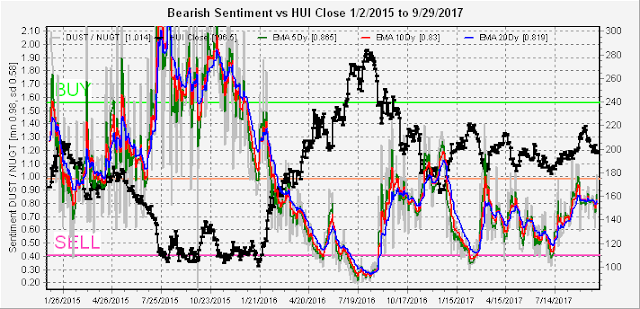
For the gold miners (HUI), traders seem completely unfazed by the HUI giving up half its gains since early July and this could lead to a scary Oct.
And for one sector (RUT) that has gone completely bananas, although there may still be some unresolved adjustment required for the May 1 split in the TNA.
II. Options & Open Interest
First looking at an update for the VIX Call Indicator, we did get the sharp run up I was looking for with most of the volume on Mon as posted on Twitter. Remember that SELLs have a 1 to 3 week lead and may be tied to the upcoming NK holidays, expected to be a missile fest on Oct 10 and 18. I added a new section in the Investment Diary, an Indicator Primer mostly for new readers, that starts with a write up of how/why I think the VIX Call Indicator works.
Moving on to the options open int charts for the SPY, last week I indicated a target of 251 (act 251.2) on a positive reaction to the tax proposal. Now putting the SPY firmly in the positive delta hedging area.
But first a warning on delta hedging, shortly after I started following OI in May, the NDX/QQQ was on a tear with positive delta hedging but during opex week dropped from 139.5 to 136 in one day, stopped only by the larger OI in June.
Back to the present. For next Wed, once past SPY 250 there is little resistance above.
But Fri shows pretty stiff resistance at SPY 252, so this may be a range bound week.
For the week of Oct 13, there is strong resistance at SPY 255 with little support until 246.
For opex week, we see something very similar to the QQQ chart for opex May shown above. Combined with the VIX Indicator SELL last week, this is a strong warning to look out for a possible drop to SPY 246 this week if a previous high of 254+ (SPX 2550) is attained. As with the NDX in May, however, this may not be the ultimate high.
Conclusions. The VIX Indicator SELL last week is pointing to at least a short term disruption in the next 1 to 3 weeks. Currently, overall sentiment does not point to a lasting top. The market may continue higher into mid month Oct to SPX 2550, but opex week could be very volatile.
Weekly Trade Alert. Nothing this week, should have been buying puts on VXX. Updates @mrktsignals.
Investment Diary, update 2017.10.xx, (in progress) Indicator Primer
Article Index 2017 by Topic
Article Index 2016 by Topic
© 2017 SentimentSignals.blogspot.com


No comments:
Post a Comment