Saturday, February 13, 2021

The Big Sideways

The Big Sideways

Last week turned out to be a good week to take a hiatus from the markets as the SPX remained in a narrow 1% range (3890-3935) after the wild 4-5% swings of the last two weeks. The general consensus seems to be that there will be a “crash up, crash down” sequence (Nomura's C.McElligott) or its opposite, while I have been looking for a rounded top. There may be a clue in the longer trend of the put-call indicators discussed in the weeks Tech/Other.  Remember, my Alt scenario is a 1987 redo where a strong economy with rising rates saw stocks rise 20% the 1st 6 mns before falling 40% the second half.

Not much change in the normal sentiment indicators. This week will continue the series of data mining indicators in the Tech/Other section with the wrap up of the Composite Put-Call Revised (Equity+ETF+SPX) indicator. Next week will continue by looking at a start for replacements of the INT and ST composites.

There have been some comments recently as to how my views are not "popular", particularly political, but remember the dictionary definition of a contrarian is "a person who opposes or rejects popular opinion", so I am always suspicious when everyone agrees on anything.


I. Sentiment Indicators

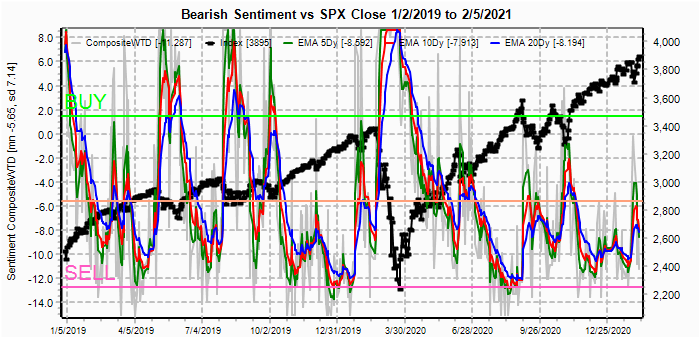
The overall Indicator Scoreboard (INT term, outlook two to four months) bearish sentiment saw a sharp drop last week, and is now in the area that should at least slow advances.

The INT view of the Short Term Indicator (VXX $ volume and Smart Beta P/C [ETF Puts/Equity Calls], outlook two to four months) bearish sentiment has fallen again to the mid-Jan levels after a modest rebound late Jan, now supporting another pullback.

Bonds (TNX).  Bearish sentiment in bonds continues to follow rates higher as the TNX closed at 1.2%.

For the INT outlook with LT still negative, the gold miners (HUI) bearish sentiment also rose modestly as prices seem to be testing the 275 support level.


II. Dumb Money/Smart Money Indicators

The option-based Dumb Money/Smart Money Indicator as short/INT term (outlook 2 to 4 mns/weeks) bearish sentiment saw a modest drop last week, and remains in the general area of the Jan-Feb 2020 top.

And the sister options Hedge Ratio bearish sentiment has fallen sharply from the late Jan spike.


III. Options Open Interest

Using Thur closing OI, remember that further out time frames are more likely to change over time, and that closing prices are more likely to be effected. Delta hedging may occur as reinforcement, negative when put support is broken or positive when call resistance is exceeded.  This week I will look out thru Feb 19 and EOM. No change and no charts until next week for TLT and GDX.

With Fri close at SPX 3935, options OI for Tue is very light.  Fri close over 3925 may cause delta hedging to push prices toward the 3960 call resistance level, but a move below 3925 may target put support at 3900.

Wed also has very small OI where SPX put support resistance zones are 3900/3950.

For Fri AM, I usually only look at the PM due to overlapping, but this week is unusual due to the large amount of unhedged calls over SPX 3825.  If the SPX can each 3975 delta hedging can support prices but a move below 3950 will likely drop to at least 3900, possibly 3850.

For EOM, SPX OI is somewhat less bearish than optn exp with put support starting at 3850 and call resistance starting at 3875.


IV. Technical / Other

This week I want to continue with the Composite Put-Call Indicator (Equity+ETF+SPX). Starting with the standard Composite Put-Call Ratio, the following chart shows the 10 day SMA for each category where the combined is based on totaling contracts. The regression correlations (R) below show that Equity P/Cs are the strongest, somewhat supporting its wide usage, but note the low ST Rs, indicating that Equity P/Cs are poor ST indicators of tops. ETF P/Cs are next strongest, while SPX has negative Rs, indicating that high P/Cs are bearish.

Next the std var Composite Put-Call Indicator is weighted by using the Rs for trading day categories for days 5-40 with 40 days given a half wt. The reason for this weighting was to give it a ST bias with the duration (days using R wts) of about 17 days, or an optimal holding period of 3+ weeks. The results shown below turned out very well with the ETF P-C given the highest wt at 38%, SPX next at 34% and Equity at 28%. Currently the overall reading is just below neutral and seems to be repeating the Sept-Oct rally/retest sequence, currently at he same level as the Oct top.

I extended the time period back to mid-2017 to emphasize an interesing pattern between he Equity and SPX P-C indicators. For the first third of the period Equity P-Cs were very high while SPX P-Cs were very low, but since early 2020 their roles reversed. Not sure what it means, but likely to indicate a major change in market behavior.

One additional data mining chart I wanted to cover is the VIX puts. Direct interpretation is difficult since moves higher can start as dumb money buying at tops as we see today, then smart money moves in as markets tank when the VIX rises. Current put levels are almost identical to that seen at the Oct 2020 high, right before a retest of the Sept lows. Rs are largest for 5-10 days and negative meaning high put levels implies lower SPX prices.

Conclusions.   I didn't miss a whole lot last week and I was able to catch up on my sleep.  With the majority now looking for the melt up/melt down scenario seen at the last three INT tops in Jan and Oct 2018 and Feb 2020 will the market surprise?  There are several indicators pointing to the likelihood of a retest of the Jan lows over the next few weeks prior to the next stimulus package expected in March.  Trader Joe sees this as a B-wave top in an expended flat with a target down to SPX 3800+/- and sentiment seems to agree, although bigger picture he is still bullish.

Weekly Trade Alert.   Next week may be an inflection for a retest of the Jan lows (SPX 3750-800), but any pullback is likely to be less dynamic that what was seen in late Jan with the ETF P-C indicator at neutral.  Updates @mrktsignals.

Investment Diary,  Indicator Primer,
 update 2020.02.07 Data Mining Indicators,
 update 2019.04.27 Stock Buybacks,
 update 2018.03.28 Dumb Money/Smart Money Indicators

Article Index 2019 by Topic, completed thru EOY 2020.02.04
Article Index 2018 by Topic
Article Index 2017 by Topic
Article Index 2016 by Topic

Long term forecasts

© 2021 SentimentSignals.blogspot.com

Saturday, February 6, 2021

Best Two Weeks Ever

Best Two Weeks Ever

Whipsaws can be fun when you are right with SPX 150+ pts to the downside and 150+ pts to the upside where the target range (3850-90) was beat by five pts.  I think I am going to retire for a few weeks and bask in the sub-freezing weather expected to envelop the eastern half of the US.

Is anyone else getting dizzy watching the range of predictions made by some of the more respected EW analysts lately?  One of the most widely followed just last Sunday was looking at the decline to SPX 3700 as the start of a larger decline, while Trader Joe in mid-Jan at least got the ST direction right, but was looking for sub 3000 for the SPX in mid-Feb.  Another whose forum I follow was talking about the end of supercycle V with the SPX targeting 3 digits after the prior weeks decline, but after a rally back to 25 pts over the prior high is now looking for an additional 25% rally.

From now on I want to standardize the language to differentiate between the normal "put/call ratios" and the std variable approach by using the term "put-call indicator" for the std variable approach.  See the Tech/Other section for a look at the ETF put-call indicator with the new Composite Put-Call indicator next week.


I. Sentiment Indicators

The overall Indicator Scoreboard (INT term, outlook two to four months) bearish sentiment saw a minor rise prior to last weeks rally, somewhat similar to the sharp selloff in Sept 2020 that may need a retest before a sustained rally.


The INT view of the Short Term Indicator (VXX $ volume and Smart Beta P/C [ETF Puts/Equity Calls], outlook two to four months) bearish sentiment has only rallied very weakly.


Bonds (TNX).  Bearish sentiment in bonds remains below neutral and is at about the same level as Jan-Feb 2020, but not likely to prevent higher rates.


For the INT outlook with LT still negative, the gold miners (HUI) bearish sentiment coninues o fade even as prices fade, not a good sign for PM bulls.


II. Dumb Money/Smart Money Indicators

The option-based Dumb Money/Smart Money Indicator as short/INT term (outlook 2 to 4 mns/weeks) bearish sentiment .


And the sister options Hedge Ratio bearish sentiment .


This week I want to look at an update fo two data mining indicators for the SPX ETFs. First, the SPX ETF term structure (SSO - CPCRevised calls) bearish sentiment.  Here, we see a big improvement, but not enough to support a sustained rally.  Note this is the old version based on (Equity+SPX+ETF puts)/(Equity+SPX+ETF calls) using contracts so needs to be replaced with new version.

Next, the SPX ETF hedge indicator (SSO - ETF calls) bearish sentiment has reversed sharply with the rapid decline in ETF calls.  See Tech/Other for more on ETF calls as a hedge.


III. Options Open Interest

Using Thur closing OI, remember that further out time frames are more likely to change over time, and that closing prices are more likely to be effected. Delta hedging may occur as reinforcement, negative when put support is broken or positive when call resistance is exceeded.  This week I will look out thru Feb 12 plus Feb 19 monthly exp.

With Fri close at SPX 3887, options OI for Mon is very light but has a bearish tilt with call resistance above 3850 and strong resistance at 3900.  Note last weeks look at the SPX data mining put-call indicators showed that low vol was bullish, so does it also effect low Oi?


Wed has small OI also, with resistance above SPX 3850 and little put support until below 3700.


For Fri OI is somewhat larger with call resistance starting at SPX 3850 and put support at 3800.


For optn exp Fri Feb 19, also very light OI where a large straddle at SPX 3750 may act as a magnet with small OI pt support below and small call resistance above.


Using the GDX as a gold miner proxy closing at 34.6 is near the bottom of its recent range.

Currently the TLT is 148 with the TNX at 1.17% as int rates rose on the basis of a Dem supported stimulus.

IV. Technical / Other

This week I want to continue the process of developing new Combined Put-Call Indicator by looking at the ETF puts & calls. The standard ETF put/call ratio for the original EMA model is shown below.


Rather than use a chart, I want to look at a table showing the results of the future price regressions.  Here we see low correlations for the std P/C for a 10 day SMA.  More importantly, looking at calls and puts separately, ETF calls have a higher correlation than the std P/C and combining with puts using the Equity & SPX (1/B - A) calc lowers the fit.  So, I decided to use the simple inverse (1/A).


Finally, the results with the inverted ETF calls only, here we see that a sharp rise in ETF calls has been present in several sharp declines in the past, supporting its use in the ETF hedge indicators for the SPX and NDX as shown a week before the recent decline.  Currently, the sharp drop in ETF calls is showing a slight bullish tilt.


Conclusions.

Stepping back to gauge the overall sentiment picture, There appears to be little support for a sustained rally at this point, but nothing pointing to an immediate collapse either.  The SPX put-call indicator using the data mining format is probably the most bullish and I will include an update with next weeks proposed put-call Composite.  Taking a look back at the rounded top of mid-2015, the options OI does agree with the circled area below where a successful retest of the recent lows around 3700 could lead to a multi-month rally into the summer with a range of perhaps SPX 3650-3950.

Weekly Trade Alert.  Some type of pullback is likely starting next week.  SPX options OI is currently showing possible targets of SPX 3800-50 by this Fri and 3750 in two weeks. Updates @mrktsignals.

Investment Diary,  Indicator Primer,
 update 2020.02.07 Data Mining Indicators,
 update 2019.04.27 Stock Buybacks,
 update 2018.03.28 Dumb Money/Smart Money Indicators

Article Index 2019 by Topic, completed thru EOY 2020.02.04
Article Index 2018 by Topic
Article Index 2017 by Topic
Article Index 2016 by Topic

Long term forecasts

© 2021 SentimentSignals.blogspot.com
Saturday, January 30, 2021

What Happened to All the Rosy Predictions?

January has pretty much followed the outlines posted with an early trading range expected between 3700 and 3800, but the Dem victory for the Georgia Senator seats set up the possibility for stronger stimulus, pushing my upside target to 3860 (act 3870) with weakness coming late in the month, likely to test the SPX 50 day SMA (right at Fri close 3714). Feb is much more uncertain with some indicators showing a Sept 2020 setup of a 7-8% decline (low ETF hedging) while others are still pointing to a Jan 2020 type decline with one more ST high (SPX 3850-90) before a 10%+ decline. My view still favors one more rally but only a 60/40% probability. A larger decline now increases the prob of SPX 4000k later, while a smaller decline favors the rounded top.

Much of what happens will depend on the GOP support for a larger stimulus package ($1.5T+), less that $1T is likely to disappoint. If the Trumpster was still stockbroker in chief, he would likely rally GOP congressmen, but with Dem Biden, less interest in market reactions and less support from the GOP is likely.

I have been making good progress on setting up a new Composite P/C using the std var format, but the CBOE data was not as useful as expected although it did show that Equity contracts are much smaller in $ and therefore should be weighted lower. So I decided to use the future returns model used to construct the Overall Composite in 2016 (more in Tech/Other).


I. Sentiment Indicators

The overall Indicator Scoreboard (INT term, outlook two to four months) bearish sentiment has risen sharply but is still near neutral.  Any rally is likely to stay within Jan trading range.

The INT view of the Short Term Indicator (VXX $ volume and Smart Beta P/C [ETF Puts/Equity Calls], outlook two to four months) bearish sentiment has rallied less strongly as Equity call buying remains strong.

The VXX $ Vol rose sharply, and close to the level seen at the Jan 2020 pullback.

Bonds (TNX).  Bearish sentiment in bonds is little changes as rates stayed between 1.0-1.1%.

For the INT outlook with LT still negative, the gold miners (HUI) bearish sentiment rose slightly as prices tested recent lows.


II. Dumb Money/Smart Money Indicators

The option-based Dumb Money/Smart Money Indicator as short/INT term (outlook 2 to 4 mns/weeks) bearish sentiment has risen sharply now slightly higher than at the Jan 2020 lows with the overall pattern similar late 2019 - early 2020.

And the sister options Hedge Ratio bearish sentiment has only seen a modest rise as hedging remains weak and could mean more volatility.


III. Options Open Interest

Using Thur closing OI, remember that further out time frames are more likely to change over time, and that closing prices are more likely to be effected. Delta hedging may occur as reinforcement, negative when put support is broken or positive when call resistance is exceeded.  This week I will look out thru Feb 5. Also, this week includes a look at both the GDX and TLT for the Feb exp. 

With Fri close at SPX 3714, options OI for Mon show fairly strong put support from 3675 to 3725 and a close at or above 3725 seems likely.  Note, however, very light OI but likely Fri decline bolstered put support.

Wed has smaller OI where SPX has put support up to 3750.

For Fri (Jan jobs data), SPX OI shows fairly strong put support up to 3750 and call resisance at 3800, in between straddles provide little direction bias.

For Feb EOM, OI is to low to be conclusive, but now indicates SPX 3650-700 possible.

Using the GDX as a gold miner proxy closing at 34.5, virtually unchanged for the week as is OI sentiment with a continued tight trading range likely.  Both puts & calls up about 50%.

Currently the TLT is 151.8 with the TNX at 1.09%, very little change here with tight range likely.


IV. Technical / Other

Starting with the Equity P/C using the EMA output it's easy to see the extremely low bearush sentiment that has everyone so worried.


Comparing the EMA format to the std var put/call spread, the biggest difference is seen when there sharp declines in SPX price since both put and call volume decline together.


While the addition of the inverse function for the puts correctly adjusts for the decline in option volume when SPX prices fall.


Finally, a regression is used to compare the current put/call measure to the difference between the current SPX price and the future price in 5 trading day increments (ie, starting Jan 2, 2018 price diff between closing SPX now and Jan 7, etc).  For the base case, I used the P/C 10 day SMA for last weeks SPX and this weeks Equity P/C.  For the SPX the changes are dramatic with a 4-5X improvement (but less than the 10X I thought last week), while for the Equity P/C the improvement averages about 2X.  The Equity P/C seems to be better INT at calling bottoms (followed by long rallies), while the SPX and ETF (next week) are better ST at calling tops (short but sharp declines).


Conclusions.   Bearish sentiment is up somewhat, but not likely enough for new ATHs.  PX options indicates a rally is likely next week to the 3750-3800 area.  Everything else is riding on the coat tails of the next stimulus package.

Weekly Trade Alert.   Highly uncertain but some type of rally is likely..  Updates @mrktsignals.

Investment Diary,  Indicator Primer,
 update 2020.02.07 Data Mining Indicators,
 update 2019.04.27 Stock Buybacks,
 update 2018.03.28 Dumb Money/Smart Money Indicators

Article Index 2019 by Topic, completed thru EOY 2020.02.04
Article Index 2018 by Topic
Article Index 2017 by Topic
Article Index 2016 by Topic

Long term forecasts

© 2021 SentimentSignals.blogspot.com

Saturday, January 23, 2021

A New Era

A New Era

Last week finally made it to my earlier target of 3860 after falling short the week of the 15th.  A move down to test the SPX 50 SMA is still possible by the EOM similar to Jan 2020, but higher prices have caused the 50 SMA to rise faster than expected to 3794 and may reach 3820-30 by Fri.  Many EWers were whip sawed with the SPX moves as pointed out last week and have now switched from bearish to bullish ST.  My target is at least a break of the prior weeks low at 3748 to get everyone bearish before a final INT rally for the next round of stimulus perhaps to only 3870-90 as many are expecting 3900+ to sell/short.

Late 2017 was not friendly to BTC and the PMs and we may be setting up for a repeat as pointed out by sentiment for HUI as well as BTC with a chart in the Tech/Other section.  This may turn out to be a precursor to a 2018-like outcome for 2021.  An interesting read last week by John Mauldin on the potential risks of the new c-virus strains.

Regular sentiment measures were relatively unchanged last week, so I've spiced things up a bit by looking at the SPX and NDX ETF hedge ratios in the DM/SM section as well as starting a new way to look at P/C ratios starting with the SPX in the Tech/Other section.  I found some interesting data at CBOE poking around their site MLK day that compares notational ($) value and volume here that might be used to create a $ wtd composite P/C ratio, the only problem is that it is clearing house data by exchange and does not use the trading floor categories for Equity, SPX, ETF and VIX.


I. Sentiment Indicators

The overall Indicator Scoreboard (INT term, outlook two to four months) bearish sentiment continues to decline, slowly but steadily, but not yet to extremes.

The INT view of the Short Term Indicator (VXX $ volume and Smart Beta P/C [ETF Puts/Equity Calls], outlook two to four months) bearish sentiment also continues to decline, slowly but steadily, but not yet to extremes.

Bonds (TNX).  Bearish sentiment in bonds is mostly unchanged as rates hover around 1%.

For the INT outlook with LT still negative, the gold miners (HUI) bearish sentiment continues to drop even as prices are weak and are approaching the levels seen before the Oct-Nov 2020 selloff.


II. Dumb Money/Smart Money Indicators

The option-based Dumb Money/Smart Money Indicator as short/INT term (outlook 2 to 4 mns/weeks) bearish sentiment has moved up slightly.

And the sister options Hedge Ratio bearish sentiment also has moved up slightly.

The INT term data mining SPX ETF Hedge Ratio (SSO/ETF Calls) bearish sentiment has reached extremes last seen in ealy Jan 2018.

The INT term data mining NDX ETF Hedge Ratio (QLD/ETF Calls) bearish sentiment is not as extreme as the SPX, but has matched the level seen before previous pullbacks.


III. Options Open Interest

Using Thur closing OI, remember that further out time frames are more likely to change over time, and that closing prices are more likely to be effected. Delta hedging may occur as reinforcement, negative when put support is broken or positive when call resistance is exceeded.  This week I will look out thru Jan 29. No charts this week GDX or TLT.

With Fri close at SPX 3841, options OI for both Mon & Wed are very small compared to Fri EOM.  Here, we see some support at 3800 and 3825 and a decline into that area is likely.


Wed has somewhat larger OI where SPX shows extremely high P/C, but puts are way OTM.  First level of support may be hit at 3755.


For Fri, call resistance exists above SPX 3825 with put support levels at 3700 and 3725.  A test of the 50 SMA around 3725-35 seems likely.


IV. Technical / Other

First, I want to take a look a Bitcoin that seems to be putting in a fractal to its Dec 2017 blow off top, wks before the SPX Jan 2018 top.  If BTC's decline continues the INT target is 18K (2017 top), does this imply a repeat of 2018 for the SPX?  It does fit my LT SPX outlook with a 10%+ decline Q1 and a mid-year rally with more weakness by EOY.

Next up is the SPX P/C ratio. Since most of my work is on the SPX, I've always wondered why its P/C ratio seems so crippled. Below is the standard EMA chart.  Note how bearish sentiment turns low well before the SPX top then rises into the top.

While this is the same ratio from the data mining software using the 10 day MA.  The 10 day SMA tracks the 20 day EMA closely, but with less volatility, due to the higher EMA weights for current data.  What is evident when including puts & calls is that volume spikes tend to occur prior to INT tops, but this is not picked up in an ordinary P/C ratio.

And finally using the inverted function for puts, the volume changes are reflected in the put/call spread, creating a put/call "ratio" that is 10X more effective.  The low volume of puts and calls since the Mar 2020 selloff actually turns out to be a bullish indicator where the low SPX P/Cs recently actually show up as neutral to positive sentiment.

Conclusions.   The fact that we made it thru Wed without any new riots probably contributed to the SPX 50 pt surge and makes you wonder about Trumps prediction of a market crash if he lost, assuming you believed anything he said.  I was expecting a rally although not to ATHs.  Now that everyone has turned bullish again, we will have to see how next week goes, but a decline below the prior weeks low at 3748 seems likely before a stimulus fueled rally into mid-late Feb.

Weekly Trade Alert.   A decline down to the 50 SMA. possibly 3720-30, by EOM or early Feb should be a buying oppty far rally back to ATHs.  Updates @mrktsignals.

Investment Diary,  Indicator Primer,
 update 2020.02.07 Data Mining Indicators,
 update 2019.04.27 Stock Buybacks,
 update 2018.03.28 Dumb Money/Smart Money Indicators

Article Index 2019 by Topic, completed thru EOY 2020.02.04
Article Index 2018 by Topic
Article Index 2017 by Topic
Article Index 2016 by Topic

Long term forecasts

© 2021 SentimentSignals.blogspot.com