Saturday, May 8, 2021

Stagflation Anyone?

Stagflation Anyone?

Last weeks outlook was for a "Sell in May" fakeout, and that was certainly what happened with a 2%+ drop thru Tue AM after a Mon rally to SPX 4200+ capped the expected early week strength.  Fri jobs report was expected to produce fireworks, but the weaker than expected outcome sent int rates tumbling and that began a short covering rally in Techs and the rest of the market followed as the FOMO crowd chimed in.  Oddly rates ended up slightly for the day.

Bearish sentiment remains near extreme lows indicating that an important top is near, but an increase in options P/C ratios may provide ST support.  A revision to the ST volume indicator presented last week is covered in Tech/Other that shows moderate/strong correlations for up to three weeks.   The indication is that a Jan 2021 type decline is possible into optn exp week where an initial decline was followed by a new high, a consolidation, and then a new low.

Recent economic data showing strengthening inflation, and waning growth may be pointing to a 1970's style stagflation.  This could prove to be an anathema for the Fed who would be loathe to raise rates that could cause an economic downturn, but is then left with limited tools to fight inflation.


I. Sentiment Indicators

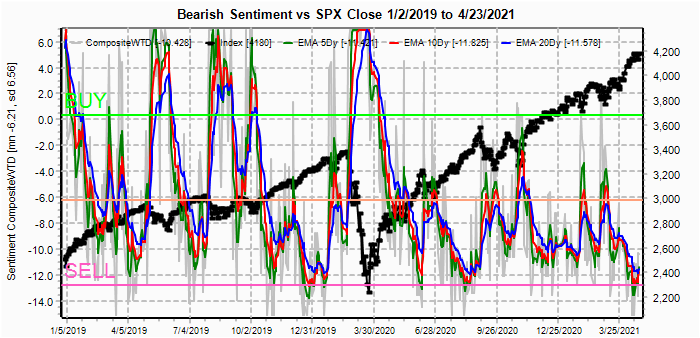
The overall Indicator Scoreboard (INT term, outlook two to four months) bearish sentiment remains at extreme lows, warning that an important top is near.

The INT view of the Short Term Indicator (VXX $ volume and Smart Beta P/C [ETF Puts/Equity Calls], outlook two to four months) bearish sentiment has increased modestly with a moderate pickup in volatility increasing VXX $ volume.

CITI Surprise Inflation Index for Apr sows a strong global pickup in inflation, except Canada.  China's catchup is probably due more to unreliable reporting than anything else.

Bonds (TNX).  Bearish sentiment in bonds continues to fall with mixed signs of economic growth.

For the INT outlook with LT still negative, the gold miners (HUI) bearish sentiment is presented in a new format using the data mining software to add the inverse TNX rate to the ETF ratio.  Falling ETF bearish sentiment has been more than offset but low options call speculation, but that may reverse soon.


II. Dumb Money/Smart Money Indicators

The option-based Dumb Money/Smart Money Indicator as short/INT term (outlook 2 to 4 mns/weeks) bearish sentiment rose slightly for the week and may be forming a rounded bottom similar to Jan-Feb 2020.

And the sister options Hedge Ratio bearish sentiment also rose slightly but not to a level that would support a sustained rally.


Since the ETF ratios have performed as well or better than the individual data mining equivalents, I am using a ratio composite of the INT term SPX LT (2X) and the SPX ST (3X) ETFs (outlook two to four mns) as bearish sentiment.  This is an INT to LT indicator and has continued to work its way lower, now considerably lower than before the Mar 2020 selloff.

The INT term NDX ST Term 3x ETF (outlook two to four mns) bearish sentiment has now completely reversed the Buy from a couple of months ago and is now in a similar position to the Jan 2020 highs.


III. Options Open Interest

Using Thur closing OI, remember that further out time frames are more likely to change over time, and that closing prices are more likely to be effected. Delta hedging may occur as reinforcement, negative when put support is broken or positive when call resistance is exceeded.  This week I will look out thru Dec 11. Also, this week includes a look at the GDX for Dec exp. 

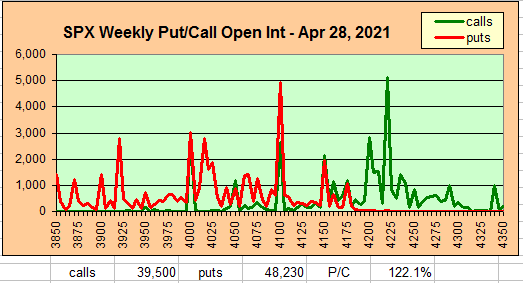
With Fri close at SPX 4233, options OI for Mon only small call resistance over 4200 until 4250 with a high P/C that may keep prices elevated.  Strong put support at 4175.

Wed has somewhat smaller OI where SPX could see downward pressure toward 4200 with put support at 4150.

For Fri larger OI also shows call resistance down to 4200 with put support starting at 4175.

For Fri optn exp week SPX options OI is similar to this Fri with call resistance down to 4200 and put support starting at 4150.

For EOQ June 30 the large call position at SPX 4115 may result in a test of that area late June.

Using the GDX as a gold miner proxy closing at 37.4, the last update Apr 16 showed little call resistance until 37 with a price at 36.  But strong call resistance at 35 & 36 could result in lower prices to the 35 level.

Currently the TLT is 139.2 with the TNX at 1.6%, prices are little changed since the Apr 16 update when the outlook was for a consolidation, but now a modest increase in puts 138 to 140 may pressure prices slightly higher and rates lower.


IV. Technical / Other

Last week, I looked at some of the components of the NYAD ($NYAD = $NYADV - $NYDEC) and NYUD ($NYUD = $NYUPV - $NYDNV), specifically the $NYDNV/$NYDEC as a capitulation indicator and the $NYUPV/$NYADV as a high risk indicator. Today I want to focus on two other ratios, especially the $NYUPV/$NYDNV, or the LT volume indicator (as an inverse for sentiment purpose). The table below shows the various components with ratios and their "fit" to future SPX returns from July 1, 2020 thru last Fri. The last two are new. The first portion of the table shows that the LT volume indicator provides a better fit than the capitulation indicator, while the second part show the result of the composite for the capitulation indicator and LT volume indicators .  The result is a 40-50% better "fit" with strong correlation thru week 3 and a moderate fit thru 5 months (100 trade days).

The chart below shows the composite results as a std var.  I will be watching this closely as a possible replacement for the ST Composite.  Two previous periods showed a similar sentiment setup.  The first was Oct 2020, where the first leg down was followed by a partial replacement then a strong leg down, and the second was Jan 2021 where the first leg down was followed by a new high, a consolidation for a week and then a second leg down to lower lows.  We may see a repeat of Jan 2021.


Conclusions.   I mentioned in the updates that the extension of the FIT tax deadline to May 17 could be an important factor for the "seasonality factor" or "Sell in May" due to the fact that many individuals contribute to 401Ks and IRAs up to that date and that the positive inflows will support the markets.  With the "Sell" from the ST NY volume indicator extending to three weeks, this could imply a very interesting option exp setup for May, the week of Mon 17th.  Above the SPX 4200 level, the SPX is in positive delta hedging which means at expiration there will be pressure down to at least 4200 and possibly to strong put support at 4100.

Weekly Trade Alert.  Next week may be a consolidation week near the ATHs if the SPX is following the Jan 2021 pattern with the potential for new ST lows near 4100 by May 21.  Updates @mrktsignals.

Investment Diary,  Indicator Primer,
 update 2020.02.07 Data Mining Indicators,
 update 2019.04.27 Stock Buybacks,
 update 2018.03.28 Dumb Money/Smart Money Indicators

Article Index 2019 by Topic, completed thru EOY 2020.02.04
Article Index 2018 by Topic
Article Index 2017 by Topic
Article Index 2016 by Topic

Long term forecasts

© 2021 SentimentSignals.blogspot.com

Saturday, May 1, 2021

A Possible "Sell in May" Fakeout

A Possible "Sell in May" Fakeout

Well, it looks like I was off by half a day with an expected high FOMC Wed as high as SPX 4225 before a modest pullback toward 4150-75.  As it turns out AAPLs EPS after Wed close was the catalyst for a move up 4218 early Thur with the following low at 4175.  During the week I was testing several new indicators using a breakdown of the NYAD & NYUD data that may indicate a ST breakdown from the current range over the next two weeks toward the SPX 4050 area as discussed in the Tech/Other section.

Most indicators are not pointing to an immediate INT top with June still a reasonable target.  Looking more closely at the May 2015 data as a possible double, the top in 2015 was 2135 and a double would work out as 4270.   There have been recent reports by Nomura of unusual US$/Euro hedges for Aug/Sept that may indicate the Fed could begin to taper its bond purchases at that time, even as ST int rates are held constant, and this may lead to increased volatility for Sept-Oct.


I. Sentiment Indicators

The overall Indicator Scoreboard (INT term, outlook two to four months) bearish sentiment remains near the extreme lows seen at the Jan 2020 top.

The INT view of the Short Term Indicator (VXX $ volume and Smart Beta P/C [ETF Puts/Equity Calls], outlook two to four months) bearish sentiment has pulled back after last weeks surge over 4200, however brief.

Bonds (TNX).  Bearish sentiment in bonds continues to weaken even as interest rates may have bottomed last week around 1.53%.

For the INT outlook with LT still negative, the gold miners (HUI) bearish sentiment is presented in a new format using the data mining software to add the inverse TNX rate to the ETF ratio.  Bearish sentiment continued is sharp decline even as prices fell with a strengthening US$ (economic growth) and int rates, possibly due to the hopes that higher inflation will save the PMs.


II. Dumb Money/Smart Money Indicators

The option-based Dumb Money/Smart Money Indicator as short/INT term (outlook 2 to 4 mns/weeks) bearish sentiment may have bottomed similar to early Jan 2020, forming a rounded bottom several weeks before the INT top.

And the sister options Hedge Ratio bearish sentiment may be also bottoming which also happened in Jan 2020.


III. Options Open Interest

Using Thur closing OI, remember that further out time frames are more likely to change over time, and that closing prices are more likely to be effected. Delta hedging may occur as reinforcement, negative when put support is broken or positive when call resistance is exceeded.  This week I will look out thru May 7.  SPX only this week.

With Fri close at SPX 4181, options OI for Mon small but with most puts & calls clustered around 4050-4250.  Fri selloff may have increased put support, but currently a retest of the 4200 area seems likely due to large put OI.  Likely range 4175-4200.

Wed has somewhat larger OI where SPX put support appears weak above SPX 4050 and could see a break below the 4175 area.

Fri is jobs report day with an expected blowout that could lead to increased volatility.  There is little put support below SPX 4150 until 4050 and strong call resistance at 4250.  A strong number may push prices over 4200 early, but may lead to an increase in int rates and a strong reversal.


IV. Technical / Other

Over the past two weeks, I have downloaded some new technical and volatility data. Today I want to look at the volume data, namely the components of the NYAD ($NYAD = $NYADV - $NYDEC) and NYUD ($NYUD = $NYUPV - $NYDNV). In the past I have used the $NYUPV/$NYDNV - as the LT volume indicator, the $NYDNV/$NYDEC as a capitulation indicator and the $NYUPV/$NYADV as a high risk indicator. Today I want to focus on the $NYDNV/$NYDEC. The table below shows the various components with ratios and their "fit" to future SPX returns from July 1, 2020 thru last Fri. The best fit came with the capitulation indicator components. The stockcharts version is here and shows that capitulation or high declining vol/issues is often a sign of ST bottoms and the reverse also works well for ST tops.


The large day to day fluctions makes the timing ambiguous sometimes and I found that combining it with the TRIN (NYDNV/NYDEC - TRIN) helps with the readability. The reason I am showing it this week is that Wed reached the the 6th Sell level (-1 SD) of the past 10 months and may be a warning of a ST breakdown. This indicator is in "trial" stage only, so use with discretion.


A slightly better "fit" was found using the Std Var version using NYDNV and NYDEC as a B - 1/A calc and the inverse TRIN. This version is slightly less bearish.


Conclusions.   Some unusual setups are accumulating that point to more significant downturn than has been seen over the last two weeks.  The NDX appears to have put in a double top around 14070 on the daily charts with the SPX showing a double top at 4215-18 on the hourly charts Thur.  Strong selling has appeared around SPX 4200 with strong reversals after blowout EPS for AAPL and AMZN.  Weakening volume technical indicators as shown by the NYDNV/NYDEC data are also a strong warning of a possible 3-4% pullback over the next two weeks, likely to the SPX 4050 area.

Weekly Trade Alert.  We may see continued strength for Mon/Tue but a breakdown is likely to start by mid-week.  Fri job report remains a wildcard and and may result in a whipsaw if the expected strength is seen.   I plan on posting updates for the options OI Wed AM.  Updates @mrktsignals.

Investment Diary,  Indicator Primer,
 update 2020.02.07 Data Mining Indicators,
 update 2019.04.27 Stock Buybacks,
 update 2018.03.28 Dumb Money/Smart Money Indicators

Article Index 2019 by Topic, completed thru EOY 2020.02.04
Article Index 2018 by Topic
Article Index 2017 by Topic
Article Index 2016 by Topic

Long term forecasts

© 2021 SentimentSignals.blogspot.com

Saturday, April 24, 2021

Do Taxes Matter?

Last week was expected to see a mild pullback of 1-2% before a rally to test the ATH by Wed Apr 28 (FOMC), and by Tue mid-day, the SPX bottomed at 4118 (down 1.5%) and actually made a new ATH Fri.  Options OI is now indicating a possible FOMC high near SPX 4225 before a decline down to/below 4100 possible by Fri.  This is also very similar to Trader Joes B Wave outlook.

The market seemed surprised Thur when Biden announced raising the capital gains tax rate on high income investors, but then reversed Fri as many concluded that resistance in Congress would only result in a rollback of Trump's tax cuts.  The more important factor may be that without higher taxes, deficit spending will pressure int rates higher which may be even more negative for stocks.  Otherwise, last weeks volatility saw little change in sentiment other than a sharp increase in VXX $ Vol which indicates that the next pullback should be BTFD.  The recent pickup in volatility has increased put buying that is likely to delay by several weeks any significant pullback.

The Tech/Other section covers similar patterns to the May 2015 top, while the data mining put-call indicators show that more time is likely before a top.  The Twitter update Tue AM saw a drop in the LT NYUPV/NYDNV to the sell level but the late reversal and subsequent rally reversed the signal.


I. Sentiment Indicators

The overall Indicator Scoreboard (INT term, outlook two to four months) bearish sentiment was little changed for the week as stocks fell early in the week then rallied back strongly.

The INT view of the Short Term Indicator (VXX $ volume and Smart Beta P/C [ETF Puts/Equity Calls], outlook two to four months) bearish sentiment has rallied more strongly (due to VXX $ Vol below) and may be following the Jan-Feb 2020 analog.

The VXX $ Vol rose sharply, with a pickup in sharp day-to-day volatility that is sometimes indicative of a topping formation.

Bonds (TNX).  Bearish sentiment in bonds saw a fairly sharp drop in bearish sentiment last week with only a small drop rates, possibly as a safe haven with the pickup in stock volatility, but likely indicative of higher rates in the future.

For the INT outlook with LT still negative, the gold miners (HUI) bearish sentiment is presented in a new format using the data mining software to add the inverse TNX rate to the ETF ratio.  Prices rallied last week as expected with the pickup in bearish sentiment, but sentiment fell even more sharply, now indicating that a resumption of the decline is not far away.


II. Dumb Money/Smart Money Indicators

The option-based Dumb Money/Smart Money Indicator as short/INT term (outlook 2 to 4 mns/weeks) bearish sentiment rose slightly last week.

And the sister options Hedge Ratio bearish sentiment rose by about the same amount.

The recent rise to ATHs in the NDX has now almost completely reversed the high bearish sentiment seen after the Jan decline and will likely limit further gains.


III. Options Open Interest

Using Thur closing OI, remember that further out time frames are more likely to change over time, and that closing prices are more likely to be effected. Delta hedging may occur as reinforcement, negative when put support is broken or positive when call resistance is exceeded.  This week I will look out thru Apr 30. Also, no charts for GDX or TLT.

With Fri close at SPX 4180, options OI for Mon moderate call OI may pressure prices down toward 4150 with significant put support there.

Wed has small OI where SPX has moderate put support at 4100 and call resistance at 4200 and more strongly at 4225 with little in between and that could contribute to wide price swings.  SPX 4225 is possible around FOMC conclusion, but could see a sharp reversal.

For Fri, SPX has stronger call resistance that could see a drop down to put support at 4075-85.


IV. Technical / Other

Over the past year, I've referred to the rounded top of May 2015 following the avian flu scare of Oct 2014 as a possible analog.  The recent daily price swings is reminiscent of the 3 mont price period around the May top where prices remained in about a 3-4% price range.  Is it a coincidence that prices are now almost an exact double of 2015?

Looking at the Composite Put-Call indicator, we may have seen the lows in Jan and Feb similar to early 2020, and in looking at the data from 2015, bearish sentiment bottomed several months before the top, moving to near neutral by May.

As I pointed out earlier, even though Equity Put-Call indicators were extremely low over the last year, SPX Put-Call indicators were very high and a INT drop may not occur until lower bearish readings are seen.

Conclusions.   The day-to-day volatility of the stock market has somewhat muddied the ST outlook as the increase in put OI and volatility hedging with VXX may delay a decline of more that 3-4% for several weeks.  Comparisons to the rounded top of 2015 showed that this type of ST volatility may go on for several months before an INT direction is made clear.  As long as int rates (TNX) remain in consolidation between 1.5-1.75% there will remain modest support for stocks, but sentiment for TNX and HUI indicate that upward pressure on rates is not far off.  SPX options activity is also increasing which us usually a sign of an approaching top, but may not reach a critical level for several months.

Weekly Trade Alert.   Things seem to be progressing mostly as outlined last week, but at more frantic pace than expected.  Next week may see another early pullback to SPX 4150-75, but a move over 4200 (possibly 4225) for FOMC Wed looks likely with the OI data.   A sudden reversal is possible to 4100 or lower by EOW or early May.  Updates @mrktsignals.

Investment Diary,  Indicator Primer,
 update 2020.02.07 Data Mining Indicators,
 update 2019.04.27 Stock Buybacks,
 update 2018.03.28 Dumb Money/Smart Money Indicators

Article Index 2019 by Topic, completed thru EOY 2020.02.04
Article Index 2018 by Topic
Article Index 2017 by Topic
Article Index 2016 by Topic

Long term forecasts

© 2021 SentimentSignals.blogspot.com

Saturday, April 17, 2021

Clouds on the Horizon

Clouds on the Horizon

Last week's melt up seemed to shatter the bears confidence as many of the sentiment indicators fell to multi-year lows and are likely an indication of an important top in the not too distant future.  There may still be some wiggle room for the bulls over the next two weeks as SPX options OI is indicating a possible 1-2% pullback ST, but an ATH retest is possible for FOMC Apr 27-8 that could be followed by volatility similar to that following the Mar 15-6 meeting with a drop to SPX 4050-100 possible by EOM.

Several new charts are shown this week starting with a composite int rate and ETF indicator for the PMs, and a composite of SPX/NDX ETF ratios.  The Tech/Other shows an update of the ETF ratio and a volatility composite.


I. Sentiment Indicators

The overall Indicator Scoreboard (INT term, outlook two to four months) bearish sentiment saw a sharp drop last week matching the levels seen in late Dec 2019 and Aug 2020, both about a month before a sharp drop.

The INT view of the Short Term Indicator (VXX $ volume and Smart Beta P/C [ETF Puts/Equity Calls], outlook two to four months) bearish sentiment is also testing the lowest levels seen over the last three years.

Bonds (TNX).  Bearish sentiment in bonds remains at a low level while rates consolidate.

For the INT outlook with LT still negative, the gold miners (HUI) bearish sentiment is presented in a new format using the data mining software to add the inverse TNX rate to the ETF ratio.  This shows the strong effect that rates have had over the last two years as prices began to rise when rates began to decline in late 2018, then prices went vertical as rates plummeted in early 2020, only to begin a long decline as rates rose late 2020.


II. Dumb Money/Smart Money Indicators

The option-based Dumb Money/Smart Money Indicator as short/INT term (outlook 2 to 4 mns/weeks) bearish sentiment has now made a new low below levels seen in Jan 2020 and Sept & Oct 2020.

And the sister options Hedge Ratio bearish sentiment has been lagging other indicators the last six months, but the melt up over the last month saw a sharp drop in hedging almost matching the Sept 2020 top.


Since the ETF ratios have performed as well or better than the individual data mining equivalents, I decided to take a look at a ratio composite of the INT term SPX LT (2x) and the SPX & NDX ST (3X) ETFs (outlook two to four weeks) bearish sentiment.  This is an INT to LT indicator and now shows the lowest bearish sentiment of the last three years.


III. Options Open Interest

Using Thur closing OI, remember that further out time frames are more likely to change over time, and that closing prices are more likely to be effected. Delta hedging may occur as reinforcement, negative when put support is broken or positive when call resistance is exceeded.  This week I will look out thru Apr 23. Also, this week includes a look at the GDX and TLT for May exp. 

With Fri close at SPX 4185, options OI for Mon is small with week/moderate call resistanceat 4150 and above that may result in a pullback to 4150 or lower.

Wed has somewhat smaller OI where SPX has very small OI between put support at 4000 and call resistance at 4200.  It makes me wonder if both call and put buyers are becoming very ST traders.

For Fri SPX OI is showing very strong support at 4100 with small/moderate call resistance at from 4150 to 4200.

For Fri Apr 30 EOM and FOMC scheduled for 27-28, an ATH retest for FOMC could be a recipe for similar fireworks to what was seen at Mar 15-16 FOMC where a sharp drop may be seen through call resistance down to 4050-100.

Using the GDX as a gold miner proxy closing at 36 shows strong put support at 31-2 and only hedges up to current price.  This is almost the opposite of what was seen a couple of months ago.  Is another lockdown coming that will push rates sharply lower and PM prices higher?

Currently the TLT is 139.3 with the TNX at 1.57%, and options OI is much the same as GDX where the large put OI at lower prices is looking like dumb money and there is almost no call resistance at higher prices.


IV. Technical / Other

Two of the data mining indicators I want to look at this week are the ETF put/callratio and the Volatility composite.  The ETF put/call ratio as a ST/INT indicator was the only P/C ratio that worked as well as the data mining indicators and is a good measure of excess speculation (high calls) and hedging (low puts).  Current levels are almost identical to what was seen at the Jan 2020 top.

The Volatility composite using the VIX Buy/Sell (VXV/VIX and Skew) and VIX P/C as an INT/LT indicator is one of the few indicators not at levels of recent INT tops and may be supportive of a May pullback before a final high in June.


Conclusions.   Last week, the SPX reached the top of the target range of 4150-200 at 4191 before backing off into the close.  Options OI is indicating a possible 1-2% pullback, but is showing strong support in the 4100 area. With the next FOMC meeting scheduled for the last week of the month a retest of the ATH is expected at that time before a more serious downturn.  The extreme low hedging and the VIX call Sell from last week indicate that a sharp but short decline of 7-8% is possible.  This could mean SPX 3850-900 as a target, or about 300 pts.  With the next FOMC June 15-16, there could be a fast and furious rally into June optn exp to setup an INT top.

Weekly Trade Alert.  It is probable that a decline of 1-2%, max SPX 4100, occurs next week, but a retest of the ATH is expect by Wed 27th FOMC.  Updates @mrktsignals.

Investment Diary,  Indicator Primer,
 update 2020.02.07 Data Mining Indicators,
 update 2019.04.27 Stock Buybacks,
 update 2018.03.28 Dumb Money/Smart Money Indicators

Article Index 2019 by Topic, completed thru EOY 2020.02.04
Article Index 2018 by Topic
Article Index 2017 by Topic
Article Index 2016 by Topic

Long term forecasts

© 2021 SentimentSignals.blogspot.com