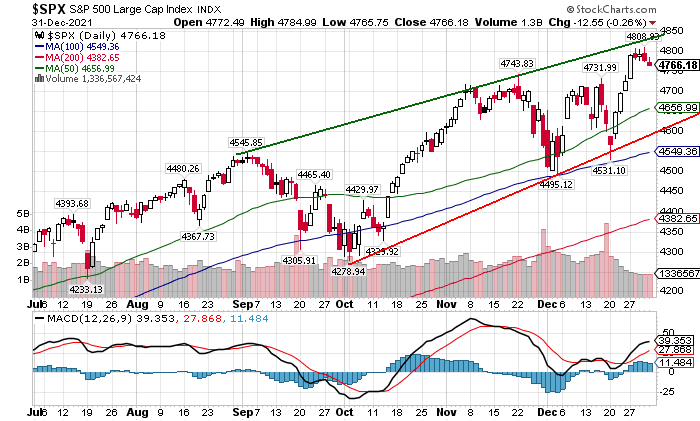
Last weeks outlook was pretty much a bust as a corrective rally was expected before any further decline. The immediate cause of the Mon selloff was a sharp rise in rates (TNX) with the decline in the SPX matching the rise in TNX, -93 pts vs +.93%. I have been warning of the risk of higher rates for months and noted last week that the low capitulation (ST Composite) would make the SPX prone to sharp and sudden selloffs. In any case, once the selloff started, it began to snowball and ended with the SPX down 9% (below 200 day SMA) abd NDX down 14%. The DJIA, however, made a higher low than Sept & Dec, but also below 200 day SMA.
INT, I had been looking for a 15-18% decline in SPX in Q1 2022 and it looks like we have a good start. For all intent and purposes. I believe the ED scenario for a new ATH is dead and the most bullish option is for a double top in SPX near 4800 in Feb-Mar. ST/INT sentiment indicates that more weakness next week is likely (SPX 4350-4450) before a sustained rally. A potential cause may be a decline in the Omicron spread or some inflation relief.
I. Sentiment Indicators
The INT/LT Composite indicator (outlook 3 to 6+ months) has three separate
components. 1st is the SPX and ETF put-call indicators (30%), 2nd the SPX 2X ETF INT
ratio (40%), and 3rd a volatility indicator (30%) which combines the options
volatility ratio of the ST SPX (VIX) to the ST VIX (VVIX) with the VXX $ volume.
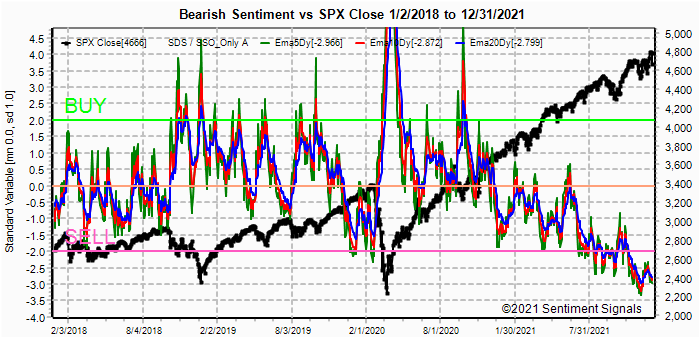
Update. From recent low extremes, ST sentiment has moved back to neutral, but still much lower than after similar declines in Feb, Oct and Dec of 2018.

Update. VXX $ Vol has moved to the highs of the last two years, but the NYDNV still lags and will likely move higher before a turn.

Update. This composite is nearing the Buy level for a multi-week rally.

Update ema. ST EMAs (grn) are at a strong Buy level and indicates a low in price is near, but LT (blue) lags so a ST range bound market is likely.


Update. Sentiment remains little changed as a brief move over 260 resistance was reversed.

II. Dumb Money/Smart Money Indicators
This is a new hybrid option/ETF Dumb Money/Smart Money Indicator as a INT/LT term (outlook 2-6 mns) bearish sentiment indicator. The use of ETFs increases the duration (term).
Update. Similar to the LT Composite, neutral was reached, but well below declines of similar size in 2018.


III. Options Open Interest
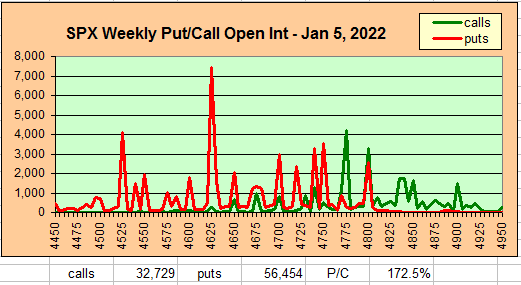
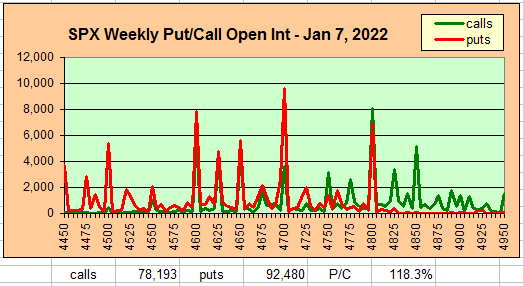
Using Thur closing OI, remember that further out time frames are more likely to change over time, and that closing prices are more likely to be effected. Delta hedging may occur as reinforcement, negative when put support is broken or positive when call resistance is exceeded. This week I'm only going to look at the larger Fri and EOM Jan 31 for SPX as well as the GDX for Feb exp and TLT for Mar exp.
With Fri close at SPX 4398, options OI for Fri is moderate with a large P/C. Put support extends up to 4600, but is unlikely to matter. A sharp break below 4350 could reach 4300 but 4400+ is more likely.


Currently the TLT is 143.6 with the TNX at 1.75%. With the TLT at 144 when TNX was 1.7% on Jan 14 and 140 when the TNX reached 1.87% on Tue, this appears to be the trading range thru Mar by OI support/resistance zones.

IV. Technical / Other
Conclusions. In a way, last weeks selloff was a lot like the "flash crash" of Aug 2015 which also occurred during an optn exp week. For months I have been referring to the rounded top of 2015 as a strong candidate for a 2021-22 top and similarities suggest a test of the highs is possible before a larger top. A recent example is seen in the German DAX that had a 9% drop in Dec then rallied to a double-top in Jan, and an important consideration is the so-called death cross of the 50 and 200 day SMAs which occurred in the 1929, 1938, 1974 and 2008 bear markets.
Weekly Trade Alert. Sentiment indicators are showing that ST/INT bottom is near, while LT (ETFs) show that much lower levels are likely before a bottom. Next week may be range bound (SPX 4350-4450) before a multi-week rally begins. Updates @mrktsignals.
Investment Diary, Indicator Primer,
update 2021.07.xx Data Mining Indicators - Update, Summer 2021 (in progress),
update 2020.02.07 Data Mining Indicators,
update 2019.04.27 Stock Buybacks,
update 2018.03.28 Dumb Money/Smart Money Indicators
Article Index 2019 by Topic, completed thru EOY 2020.02.04
Article Index 2018 by Topic
Article Index 2017 by Topic
Article Index 2016 by Topic
Long term forecasts
© 2022 SentimentSignals.blogspot.com