Sunday, February 21, 2016

Not Much Change from Last Week

Last week I reported mixed sentiment and this week we have similar results with the SPX advancing from 1865 to 1915.  Looking at all sixteen indicators, last weeks score was 6/16 with 9 positive, 4 neutral and 3 negative. This week the score has dropped to 4/16 with 8 positive, 4 neutral and 4 negative as the overbought/oversold indicator(SPXa50r/SPXa150r) moved to a negative.

The big news is for the HUI (DUST/NUGT) as bearish sentiment dropped to a low extreme as the chart below shows   It is interesting that Hulberts Digest Newsletter Survey just reported the same results. However, I am less bearish than Hulbert due to the large buildup of high bearish sentiment the last half of 2015.  The most likely scenario is a 3 to 6 month trading range, aka the first half of 2014, until volatility subsides in the stock market.  Unlike most, I expect a fairly positive second half of the year for stocks after a summer swoon, as Wall Street pulls out all stops to protect the $100 million plus investment in the Clinton campaign to preserve the status quo.


The rest of this post is an update to the Students Trifecta model where I am replacing the BPSPX/CPCE indicator with the original TRIN variable and BPSPX (TRIN/BPSPX).  TRIN does not fit well in my model as most use log tranforms so I had to come up with another approach.

Below is the TRIN/BPSPX, here I found that the BPSPX improves the cyclicality.

The revised Students Trifecta ( VXV/VIX, SPXA50R/SPXA150R, and TRIN/BPSPX).

Short term outlook.

Looking for a drift lower into early-mid Mar, possible IHS at SPX 1820-30. Fed announces second rate hike, then pauses until after election plus ECB additional QE. Stocks stage strong rally, SPX 2000+ Apr-May. Then crash down into 1700s in summer swoon, aka 1957, 1969.

Saturday, February 13, 2016

Despite the Double Bottom on the SPX, Sentiment is Mixed

Today, I am going to do something a little different, which is focus on sentiment components rather than composites.  The reason is that some indicators are showing a strong buy (SPX), while others are showing a sell, and when combined I get a neutral signal.  For instance, the put/call ratio for the CPC and CPCI (less VIX) are neutral, while the equity P/C is a strong buy and the ETF P/C is a sell.  First, I will show the charts for the latter P/C ratios as well as the VIX term structure for the SPX (VXV/VIX) and NDX (VXN/VIX), and try to explain what I think is going on.  For the gold bugs, no charts, but sentiment is neutral so no big selloff is expected.

 The equity P/C shows extreme bearish sentiment about equal to the Aug 2015 selloff.

The VIX term stucture (SPX) also shows extreme bearish sentiment similar to Jan 2015.

The ETF P/C, however, tells a different story with bearish sentiment below the mean similar to early 2015 and the Nov 2015 top.

The VIX term structure (NDX) is not as reliable as the SPX form, but again the low readings are more consistent with tops than bottoms.

What I decided must be going on is that the average stock, represented by the equity P/C and VIX term structure (SPX), has been a bear market for over a year and sentiment has now reached a bearish extreme indicating a buy.  However, the large cap stocks (ETFs), especially the techs (ie, FANGS) that have been holding up the averages still have further downside before a significant rally is expected (ie, 10-15%).

So if you are a stock picker now might be the time to start picking up beaten down stocks (gold miners might be an example of what to expect), otherwise lower lows are expected for the averages.  I have using NDX 3800 as a target since mid-Jan and with trend lines from 2009 coming in around SPX 1750 and NDX 3780, a strong rally from those points is expected when/if reached.

Saturday, February 6, 2016

Should You be Worried about the Low VIX Put/Call Ratio?

Everyone looks at put/call ratios occasionally, but the CBOE publishes data on other ratios than the widely followed CPC (combined) and CPCI (index).  Two of my favorites are the SPX and VIX P/Cs.  After the 2007-08 bear market, there was a huge growth in volatility products to hedge risk, and this included puts and calls on the VIX.  CBOE includes VIX calls in the calls for both CPC and CPCI, likewise for puts, so to eliminate the distortions, I use modified CPC and SPX for CPCI.

To get back to the main subject, a large volume of calls on the VIX is a bet on increased volatility.  Friday for instance the VIX P/C was 0.14 with 700k calls or 30% of the 2.4m reported for the CPC and almost 60% of the calls in the CPCI.  The reported CPCI, for instance, was .81, but without the VIX calls the number jumps to 1.80.  The SPX P/C was 1.79.

So what does this mean for an investor?  Long-term the VIX P/C averages about .50.  VIX call buyers tend to be "smart money" investors, such as hedge funds and pension funds, looking for a way to hedge risk.For instance, for the five days from Dec 29, 2015 to Jan 5, 2016 the VIX P/C averaged .25 and the next two weeks the SPX dropped from 2017 to 1812.  Before that in mid-Aug 2015, the five day average dropped to .30 before the Aug crash.  Friday, Feb 5, the 4-day avg dropped to .2 and the 5-day to .30.  What are VIX call buyers afraid of?

The following shows a VIX P/C sentiment chart with the current 5-day EMA at .30.

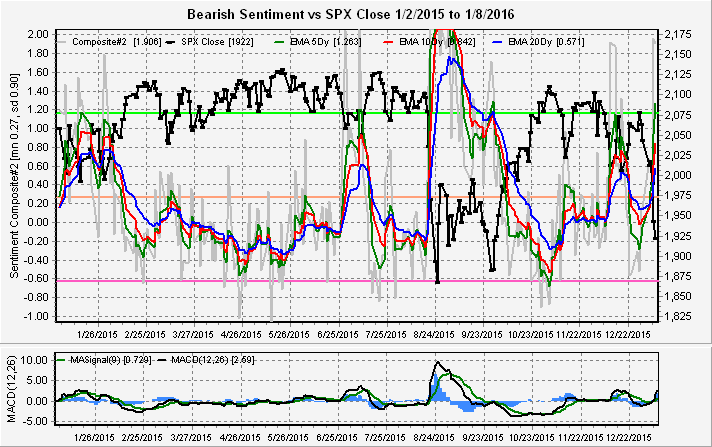
The next two charts show updates for the composites, #1 (P/C, VXX $ Vol, Skew) and #2 (P/C, VXX $ Vol, VXV/VIX).


Composite #1 remained steadfastly bearish (low sentiment) from Sept thru mid-Jan, mostly due to the Skew which remained in the mid-140s, only recently dropping below 120.  This composite is now bullish.  Composite #2, below, is also bullish, but not as mush so as after the Aug crash and retest.


Overall, sentiment seems to be pointing to some type of short-term washout using the VIX P/C, followed by a sizable rally of several months, but no new highs.

Saturday, January 23, 2016

How do Sentiment Measures Work in Bear Markets?

Over the holidays, I downloaded several indicator components from stockcharts.com going back to 2001 in order to see how sentiment indicators would work in bear markets.  Many of the variables I use were either non-existent or had insignificant volume prior to 2009, including volatility products and leveraged ETFs.  However, I was able to reconstruct the Trifecta Model copied from the Humble Students blog.  This model consists of the VIX term structure (VXV/VIX), SPX overbought/oversold indicator (SPXA50R/SPXA150R), and TRIN. I replaced the TRIN with a measure of market strength I've been using for over a year, the SPX bullish percent divided by the equity put/call ratio (BPSPX/CPCE).

The following chart shows the performance of the Students Trifecta from Apr 2007 to Apr 2009.


Early 2007 showed very low bearish sentiment until the July-Aug selloff that increased bearish sentiment to an extreme > 1 SD over the mean.  However, by the time the market had rallied to a new high in Oct, bearishness had fallen to a low extreme, marking a market top.  This was followed by a selloff of about 18% into mid-Jan 2008 that generated much lower lows in stock prices but lower highs in bearishness.  After rallying into early Feb, over the next several weeks the market traded sideways to down, until a sharp rally occurred in Mar-Apr.  This time bearish sentiment reached an even lower extreme than the Oct 2007 high.  Of course, during this time President Bush was claiming that the economy was the strongest he had seen, Ben Bernanke appeared on TV claiming the the sub-prime problem was well-contained, and market pundits were predicting DJIA 20,000 by the end of 2008.

But then we had the October crash were the SPX fell 30% from 1200 to 800 and bearish sentiment reached a severe extreme over 2 SD from the mean. But never fear, a year-end rally of 20% convinced everyone that the worst was over and bearish sentiment fell to the level of the Oct 2007 high, only to be followed by a plunge into March 2009.

The next chart shows the period from 2011-12, the Euro (Greece) crisis.  Here, the Students Trifecta performed fairly well, but not as well as 2007-09, probably due to the fact that the source of the crisis was overseas and not as well anticipated.


So where does that leave us today looking at the period from the second half of 2014?  Oddly, the Aug selloff with very extreme bearish sentiment, followed by an Oct rally that produces low bearish extreme sentiment, followed by a Dec-Jan selloff that produces less extreme beariush sentiment seems to be repeating the 2007-08 fractal.  I would become extremely worried if a Mar-Apr rally produces lower bearish sentiment than we saw in Oct-Nov of 2015.


How does the Student Trifecta model compare to other sentiment models? Below is the Composite#2 (Put/Call, VXX $ Volume, and VXV/VIX).  As I have noted before there is a high correlation between many of the sentiment models as are these, although the Composite#2 may be better at picking tops.


What exactly does the BPSPX/CPCE show?  When used alone this is a confirming, not a contrary indicator as high levels indicate underlying market strength.  This also tends to be a leading indicator and gave several months notice before the Aug decline.  The levels today are almost a mirror image of the first half of 2014, extreme high to extreme low, indicating lack of internal strength.


Monday, January 18, 2016

Today is going to be a long post, at least in terms of charts, since am introducing new sentiment charts for two new stock indexes.  For the Russell 2000 (RUT), I will use the short/long ETF pair TZA/TNA, and for the Nasdaq 100 (NDX), I will use the ETF pairs QID/QLD and SQQQ/TQQQ.  All charts are shown since July 2014.

First for the broad market (SPX) everyone knows that bearish sentiment is high, but several measures show that it is not as high yet as Oct 2014 or Aug 2015.


Composite#1 uses Put/Call, VXX $ Volume, and Skew, and the high Skew readings due to elevated put premiums have indicated low bearish sentiment or high risk since Oct. 2015, and overall has only last week moved into a moderately positive stance.


Composite#2 uses Put/Call, VXX $ Volume, and VXV/VIX.  Here, we see that the short and intermediate (5, 10 dy ema) now exceed the +1 SD extreme, but the 20 dy is only at 1.1 compared to > 1.6 for both Oct 2014 and Aug 2015. Hence my argument for an "L" type bottom (lower for longer) to allow the longer term sentiment to rise to an extreme.


The SPX ETF measure SPXU/UPRO shows much the same result as Composite#2.


The RUT ETF sentiment ratio TZA/TNA is a classic example of how sentiment should effect stock prices over the long term.  In late 2014 and early 2015, bearish sentiment was very high and the result was a 20% advance through the first half of 2015 or almost twice that of the SPX.  However, the second half of 2015 saw consistently low levels of bearish sentiment, and the RUT has now given up all its gains since Oct 2014 and more.  The period starting in June 2015 is where I see the bond chart posted last week.


Both the RUT and NDX ETF sentiment measures showed a strong warning of a decline at the end of December when bearish sentiment spiked to a low extreme.  For the QID/QLD sentiment indicator, short term measures are high, but long term (20 dy) have not yet reached +1 SD at 1.3 where Oct 2014 and Aug 2015 declines reached 1.6.  The NDX appears likely to test the 3800 level before a significant rally.


The NDX ETF pair SQQQ/TQQQ shows similar results, but given the low level of shorts to longs b dollar amount, it is probably less reliable.


Finally, for the gold miners HUI index, the sentiment using DUST/NUGT seems to be getting worse every day (less bearish).  The rapidly declining sentiment as mining stocks are stuck in a narrow trading range is very similar to mid-2014 which resulted in about a 30% decline.

Sunday, January 10, 2016

 Last weekend, I warned that the sharp drop in bearish sentiment during the Dec rally in the SPX from 2005 to 2082 would likely lead to an even sharper decline into mid-Jan, but I was wrong about the positive start to the month.  Here we are mid-month and now have an extreme bearish sentiment reading for the SPX.  First, the Composite#2 (Put/Call, VXX $ Vol, VXV/VIX) has now reached +1 SD from the mean, which typically indicates a +100 point or more move in the SPX.  Note that in the case of Oct 2014 and Aug 2015 bearish sentiment did go much higher.  Looking for SPX bottom in the1880-1900 range by mid-week.

The SPXU/UPRO etf ratio is showing much the same sentiment, where after warning of a likely decline in late Dec, is now indicating a significant rally is likely.

I am introducing a new etf indicator for bonds using the TBT/TLT as short/long synthetic put/call ratio.  Since there is no price index for bonds, I am using the TNX, 10-year yield measure, just remember that bond prices increase as yields go down.  Starting in Jan of 2014, bearish sentiment was very bearish for bonds and over the next 14 months rates dropped from 3% down to 1.6%.  Now sentiment is almost the exact opposite of Jan 2014 (extremely low), having fallen sharply following the Aug 2015 stock decline and more so recently.  Could this be the setup for Martin Armstrong's big bang when investors flee bonds and move into stocks?  It looks like bonds should top soon with 10-year rates possibly reaching 3% by the EOY.

Finally, the gold miners sentiment measure using DUST/NUGT etfs.  Here, we see a very sharp drop in bearish sentiment similar to bonds as investors seem to be fleeing to safety havens.

Sunday, January 3, 2016

Last update, I posted that a moderate bearish sentiment indicated a possible 4-5% rally into January and we got a 4% rally from SPX 2005 to 2082 then pulled back to 2044 to end the year.  It is interesting that the year-end pullback lowered the bar for the "January indicator" where a positive first week and month indicates a positive year.  Now this can be accomplished with closes over SPX 2045.  I do expect a positive start to the year followed by a mid-month pullback, then a rally into the FOMC meeting Jan 27-8 with chatter about dovish language to make rate future hikes "data-dependent".

Sentiment  charts for this week include SPXU/UPRO, Composite#2, and DUST/NUGT.  I am starting to really like the short/long ETF indicators due to their effectiveness as well as simplicity and ease of understanding and will be adding several others in the next few weeks.

First the SPXU/UPRO ETF.  Here, the bearish sentiment has fallen rapidly from a moderate bearish level (bullish) to an extremely low level (bearish).


.The Composite#2 (P/C,VXX Vol,VXV/VIX) has also shown a sharp decline in bearish sentiment, but not as extreme as the SPXU/UPRO ETF.


 The DUST/NUGT sentiment indicator has shown the biggest surprise as bearish sentiment has fallen below the mean, indicating a weak sell signal.