As the US/NATO and Russia squared off, neither side was willing to budge, and Russia decided to call the other side's bluff and now the Ukrainians are paying the price. Somewhat interesting that the spring of 2008 was when Russia invaded Georgia, to the south, but it was quickly forgotten due to the financial crisis.
Obviously my "negotiation outlook" was off the mark, but two weeks ago I (Call Me Skeptical) gave an "invasion target" of SPX 4100-200 (act 4115). My primary call for the week was there would be several daily swings of SPX 100 pts and by my count there were 6 in 4 days, highlighted by Thur 1st hour low of 4115 followed by a 180 pt rally. Longer term, since Jan I had been looking for a complex bottom. The Tech/Other Section takes a look as to how this may play out with comparison to 2018.
As mentioned in the Fri AM update (good for about SPX 50 pts), the ST Composite reached a Buy level at the Thur close, but the final volume data was not available until 30 min after the next days open. In the Tech/Other Section arguments are shown for a ST consolidation (SPX 4250-.400, +/-50), while the SPX 2x ETFs are compared to the Aug 2017 period before a 5 month melt up of 20%.
I. Sentiment Indicators
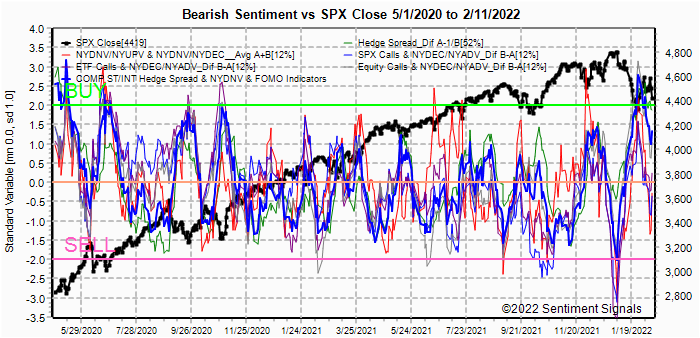
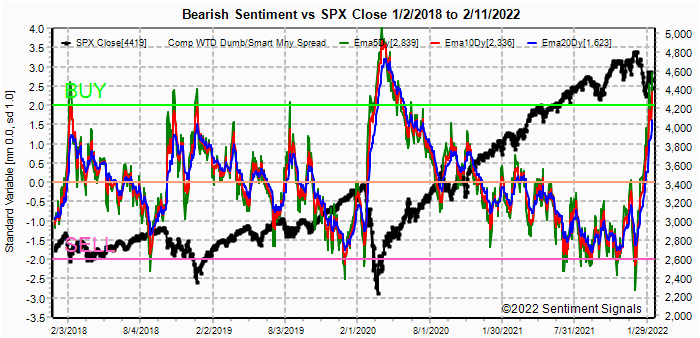
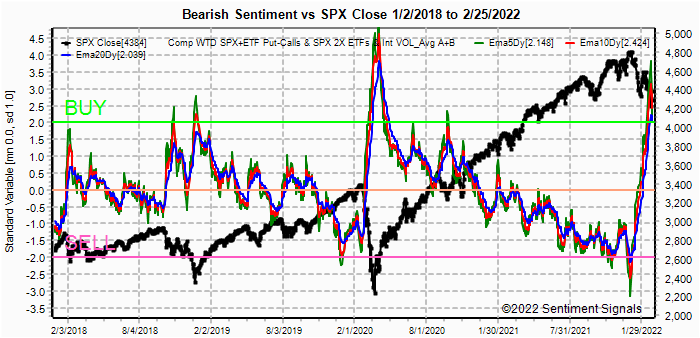
The INT/LT Composite indicator (outlook 3 to 6+ months) has three separate components. 1st is the SPX and ETF put-call indicators (30%), 2nd the SPX 2X ETF INT ratio (40%), and 3rd a volatility indicator (30%) which combines the options volatility ratio of the ST SPX (VIX) to the ST VIX (VVIX) with the VXX $ volume.
Update. Bearish sentiment reached a strong Buy led by the SPX ETFs and Vol measures, while options (SPX and ETF) are lagging that may mean more choppiness ST.

Update EMA. Bearish sentiment is the strongest of the last 4 years after Mar 2020.

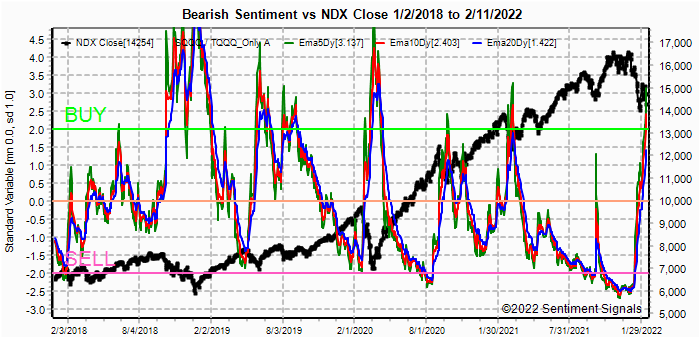
Update. A ST Buy was generated, but note this does not rule out choppiness as seen in Sept and Dec 2020.

Update FOMO. The options components are lagging and may indicate choppiness ahead.

Update EMA. Strong hedging continues to keep the ST/INT composite on a strong Buy.


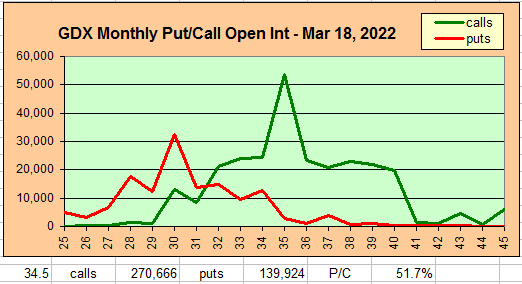
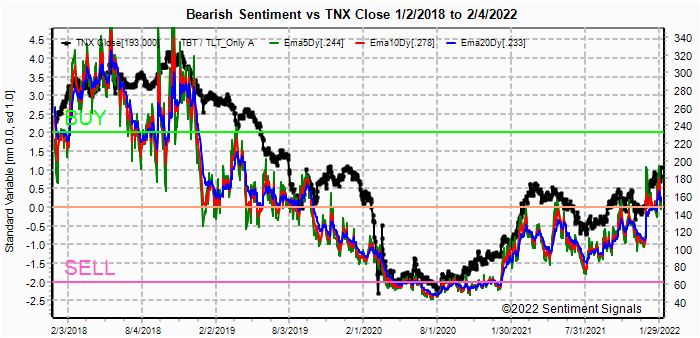
Update. Range for HUI of 250-85 from Mar OI for GDX still holding, while sentiment continues to fall.

II. Dumb Money/Smart Money Indicators
This is a new hybrid option/ETF Dumb Money/Smart Money Indicator as a INT/LT term (outlook 2-6 mns) bearish sentiment indicator. The use of ETFs increases the duration (term).
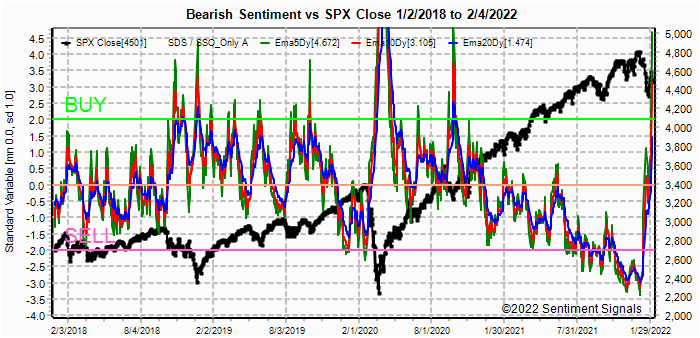
Update. The sharp rise in bearish sentiment is being fueled by the SPX ETFs shown below.


III. Options Open Interest
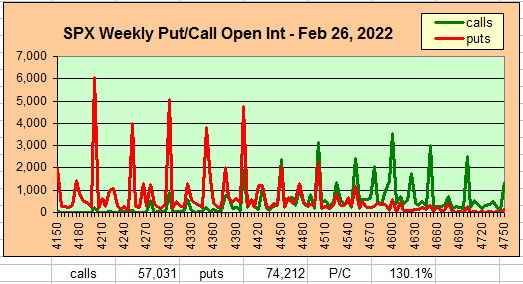
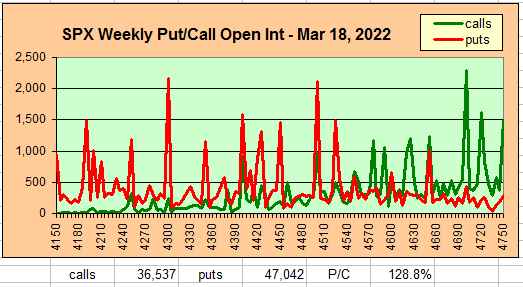
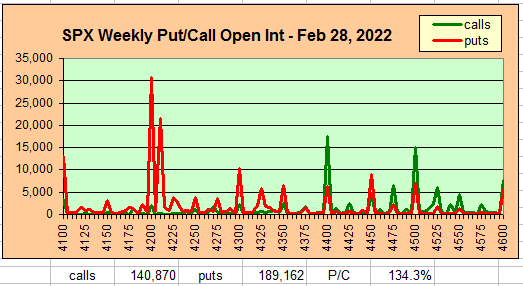
Using Thur closing OI, remember that further out time frames are more likely to change over time, and that closing prices are more likely to be effected. Delta hedging may occur as reinforcement, negative when put support is broken or positive when call resistance is exceeded. This week I will look out thru Mar 4.
With Fri close at SPX 4385, options EOM OI for Mon is large with strong put support near 4200 and moderate support up to 4350. Call resistance starts at 4400.


IV. Technical / Other
This week I will look at several comparisons to 2018, first a retest of the spike lows spent a couple of weeks consolidating before beginning a rally that in 2022 could be into the FOMC (Mar 15-16) or EOM before a second retest. From the Apr lows it took 5-6 mns to the Sept-Oct highs.

The second chart looks at the SPX 2x ETF sentiment indicator from 2017-18. Here, we see that the SPX 2x bearish sentiment for the Aug 2017 decline at the start of Trumps trade war/sanctions with China lead to a strong BTFD oppty for a 20% rise into Jan 2018. Its really surprising that after that fakeout, the bears missed out on all other opptys in 2018. Are we seeing a similar setup for 2022-23?

One possible reason for the 2022 huge spike in SPX ETF bearish sentiment is shown below from a recent Grantham GMO reprinted in ZH. In fact, I mentioned this as my LT outlook for SC4, but this does not mean that there won't be ST/INT pain from taking a LT short position in SDS. As they say "timing is everything".

Conclusions. All in all, last week went pretty much as expected with the exception of the invasion of Ukraine Wed nite. I was expecting some type of compromise or at least a 5 to 10 year hold on NATO expansion, but it seems to me that the military industrial complex insists on always having some bogeyman, whether be the Ayatollah in the 1970s and 80s, Sadamm in the 1990s and early 2000s, or bin Laden/ISIS until recently, to justify the $100s of billions spent on warfare every year. Now we have Putin.
Surprised at the SPX 2x ETF sentiment I looked at historical periods and found the same run up in bearish sentiment at the onset of Trumps trade wars with China. Ultimately the bears were proven right but not before suffering a large drawdown on short positions as the ST result was a 20% melt up into a final high. I doubt if many stayed around to celebrate. A comparable rally based on current sentiment would be 20-30% from recent lows or SPX 4900-5300, likely by the mid-term election.
Weekly Trade Alert. I seem to be wrong every time I say
this, but the next week or two is likely to be range bound from SPX 4250-4400,
+/-50.
A rally is possible into opt FOMC/exp week to about 4500 with a decline to
follow then a push over 4500 by EOM Mar. Updates @mrktsignals.
Investment Diary,
Indicator Primer,
update 2021.07.xx
Data Mining Indicators - Update, Summer 2021 (in progress),
update 2020.02.07 Data Mining Indicators,
update 2019.04.27 Stock Buybacks,
update 2018.03.28 Dumb Money/Smart Money Indicators
Article Index 2019 by Topic, completed thru EOY 2020.02.04
Article Index 2018 by Topic
Article Index 2017 by Topic
Article Index 2016 by Topic
Long term forecasts
© 2022 SentimentSignals.blogspot.com