Last week a pullback was expected within a general range of SPX 4100 to 4220 thru mid-June with a warning that prices could be driven by debt ceiling rumors. Initial negative debt ceiling rumors took prices to the Wed SPX put support level at 4105, but a more positive outlook took the SPX back to 4215 with the help of more AI fueled mania from Nvidia's chip outlook. Next week could see something similar with some disappointment Thur-Fri if the initial June 1 X-date does not see a debt ceiling deal and June 2 sees another strong jobs report, pushing int rates higher. With the new X-date set for June 5 (Mon), a late week rally and follow thru the next Mon is likely. The debt ceiling rumors are starting to remind me of the Fed "pivot" rumors that were so common a few months ago, and I just wonder if the media or WS is running the rumor mills. I saw a recent article comparing this debt ceiling "crisis" to 2011 which only ended after a stock market "panic" in Aug.
The sharp rise in int rates (TNX) continued last week with rates closing in on 4% with a close at 3.8%. Last week economic data for US GDP for Q1 was revised upward to 1.3% from 1% and PCE remained "sticky" rising to 5%, dashing hopes for the desired "pivot" late 2023. The high in rates last Oct was 4.3% and a move over 4%, possible with another strong jobs report June 2, is likely to negatively effect stock prices.
With prices remaining in a tight range many of the sentiment indicators remain in a tight range with the notable exception of the hedge spread that is dropping sharply and the ST Composite that turned positive, so expect more volatility with a possible positive bias.
I. Sentiment Indicators
The INT/LT Composite indicator (outlook 3 to 6+ months) has three separate components. 1st is the SPX and ETF put-call indicators (40%), 2nd the SPX 2X ETF INT ratio (30%), and 3rd a volatility indicator (30%) which combines the options volatility spread of the ST SPX (VIX) to the ST VIX (VVIX) with the UVXY $ volume. This week breaks SPX options into volume adj (1/B-A) and traditional spread (A-B).
Update Alt. In this case the wts for the SPX 2X ETF ratio (SDS/SSO) and SPX puts & calls spread are adj to equal as in the DM/SM section for SPX ETFs. Bearish sentiment remains unchanged at the weak Sell.


Update. Bearish sentiment imprived slightly, but remains near neutral.

Update EMA. Bearish sentiment very ST (grn) moved to positive.

Update EMA. Bearish sentiment has moved to slightly more negative.

Bonds (TNX). Bearish sentiment remains mostly unchanged as TNX int rates at 3.8% are nearing the important 4.0% level.

Update. Bearish sentiment increased somewhat as prices continued to fall, but remains negative near the weak Sell.

II. Dumb Money/Smart Money Indicators
This is a new hybrid option/ETF Dumb Money/Smart Money Indicator as a INT/LT term (outlook 2-6 mns) bearish sentiment indicator. The use of ETFs increases the duration (term).
Update. Bearish sentiment rose slightly but remains near the weak Sell.


For the SPX, I am switching to hybrid 2X ETFs plus SPX options. Taking a look at the
INT term composite (outlook 2 to 4 mns), bearish sentiment is down slightly.

Bearish sentiment is mostly unchanged despite the 5% rally last week, now well above the 13.7k target since Jan, and now challenging the 62% retrace of the entire 2022 decline.

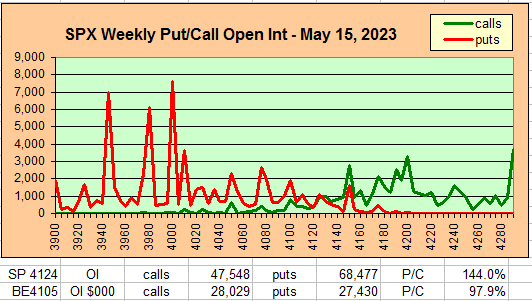
III. Options Open Interest
Using Thur closing OI, remember that further out time frames are more likely to change over time, and that closing prices are more likely to be effected. Delta hedging may occur as reinforcement, negative when put support is broken or positive when call resistance is exceeded. This week I will look out thru June 2. A text overlay is used for extreme OI to improve readability, P/C is not changed. Also, this week includes a look at the GDX and TLT for June 16 exp. An addition is added for OI $ amounts with breakeven pts (BE) where call & put $ amounts cross.
With Fri close at SPX 4205, options OI for Tue is small with call resistance at 4200 and over, and put support at 4125.


Using the GDX as a gold miner proxy closing at 30.4, fairly strong put support may limit the downside to 29.5, while a move over 31 could rise to 33.

Currently the TLT is 101.1 with the TNX at 3.81%, the recent rise in rates must be befuddling to all of the bond bulls (calls), and TLT has fallen almost to put support at 100.5, any lower could target the next support level at 95 (TNX 4.25%).

IV. Technical / Other
The following uses barcharts.com as a source and discusses S&P futures (ES) as a third venue of stock sentiment in addition to options and ETFs. The non-commercial/commercial spread represents a LT bearish sentiment (dumb money/smart money) indicator. As explained in investopedia, commercial investors (red) are institutions and are smart money, while non-commercials (green) are speculators such as hedge funds and are dumb money. Here is the current barchart graph for the S&P 500 (top) and trader positions (1st bot) with positives as net longs and negatives as net shorts. Bearish sentiment is represented by the spread and is positive if red > green (Buy) and negative if green > red (Sell). Sentiment is a strong BUY.
Conclusions. One thing I wonder about all of the debt ceiling
discussions is why no one talks about the effects of inflation. With close
to half of all spending indexed to inflation (including entitlements, govt and
military salaries) and likely others. the same amount of dollars buys less every
year. Of course, inflation has been a tactic used by governments to pay
off debts for centuries since the Romans. With inflation at 5% and 10 year
int rates at 4%, the gov't gets paid 1% a year (negative int rates) to borrow
money and at the end of 10 years pays the money back with dollars worth half as
much. Recognize that nominal GDP and tax revenues also increase at the
rate of inflation, so in 10 years GDP and revenue doubles and debt to GPD
decreases by 50%.
My estimate is that the current debt limit debates have a 50% chance of dragging
out for weeks, and if past June 16, then months.
Weekly Trade Alert. If no debt decision by June 1, then down thru
Fri AM possibly to SPX 4100, then up thru early following week. Updates @mrktsignals.
Investment Diary,
Indicator Primer,
Tech/Other Refs,
update 2021.07.xx
Data Mining Indicators - Update, Summer 2021,
update 2020.02.07 Data Mining Indicators,
update 2019.04.27 Stock Buybacks,
update 2018.03.28 Dumb Money/Smart Money Indicators
Article Index 2019 by Topic, completed thru EOY 2020.02.04
Article Index 2018 by Topic
Article Index 2017 by Topic
Article Index 2016 by Topic
Long term forecasts
© 2023 SentimentSignals.blogspot.com