Saturday, May 27, 2017

Consolidation, then What

After first tackling the SPX 2400 area in early Mar, the market finally hurdled over last week to reach my LT objective of 2415.  Sufficient bearishness remains for a consolidation between 2400 and 2420 for a couple of weeks, but an INT decline of 7-8% should still start by early July.  Rising TRIN and falling VIX P/C may also trigger a High Risk warning by June expiry, even though the last one only resulted in a disappointing 2% drop. This week will also include an update of the option open interest.

I. Sentiment Indicators

The overall Indicator Scoreboard has moved back to a less supportive neutral position and may not reach a full SELL before an INT decline.


The Short Term Indicator (VXX $ volume and Smart Beta P/C) using S/T EMAs after giving a ST BUY is now approaching the SELL region, although the rate of decline is likely to slow as prices stall out.


The biggest surprise in sentiment for the week was probably in bonds (TNX) as bearish sentiment levels has now fallen to levels where a significant rise in rates has occurred in the past   A continuation of this trend while stocks consolidate is consistent with a rise in rates from Jul-Sep as stocks are expected to fall.


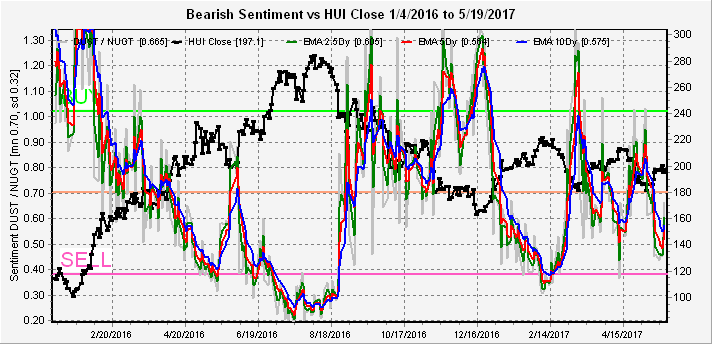
A second surprise was with gold stocks (HUI) as bearish sentiment rose as prices consolidated in a similar b-wave flat to the Mar period.  It's beginning to look as if prices will rise to about the 205-210 (GDX 24) area as stocks and bonds fall from Jul-Sep.


II. Options Open Interest

This is probably the last time I will take a detailed look at this area as I was just looking for a shorter time view sentiment measure and have decided to rely on the combined monthly and weekly since the weekly contain too much noise for my purpose.  If you wish to view the weekly commentary, please visit SassyOptions.

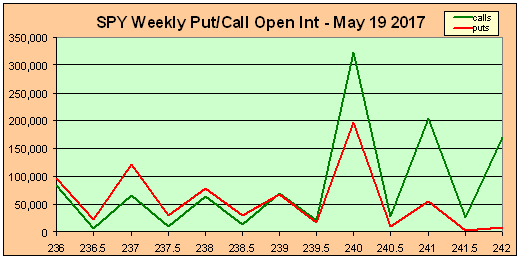
This is the chart of the combined monthly and weekly for June.  This clearly shows why SPY 240 was such a big deal and why 240 to 242 may be a resting zone, where puts provided strong support up to 240, while calls showed very strong resistance at 240 and strong at 242.


The June monthly currently shows declining put support above SPY 235 that may allow prices to move lower as option expiry approaches.


For the coming week, Wed OI looks like prices could jump all over the place which is why at first I thought shorting might be a good idea, but concluded that volumes were so low that the effects would likely be minimal.


SPY Fri OI makes more sense and together seem to indicate that prices would remain in the 241-242 range for the first part of the week but fall to the 240 level by the end of the week.


Looking at some of the other indices, the NDX/QQQ easily ran over resistance at 140 and looks like it could continue higher.


GDX looks like it will still remain in the 22-24 range.


Finally, VIX is somewhat hard to interpret since it easily fell below 10 and appears on its way to 9.


Conclusions.  A number of indicators suggest a return to the SPX 2350 area may be likely by mid or late June but more consolidation is likely first to reduce the level of bearishness.  This may take one or two weeks.

Weekly Trade Alert.  We made it to the SPX 2415 shorting area and I even posted a trade on Twitter, but stopped for a small gain (SPY ATM put in/out 1.84/2.01).  With the SKEW at 123, I would rather wait for a SELL than try to top tick.   Updates @mrktsignals.

Article Index 2017 by Topic
Article Index 2016 by Topic

© 2017 SentimentSignals.blogspot.com

Saturday, May 20, 2017

Which Way Wanda

What a week, my outlook for the next month was compressed into three days with a drop from SPX 2405 down to the 2320-50 range and back towards 2400.  I was somewhat distracted Mon & Tue working on an option open interest model which in the long run helped me to understand what happened, but in the short term contributed to missing the trade.  Several posts were made on Twitter indicating that the huge jump in VXX volume was likely to truncate the decline and cause a sharp rally in a few days. This weeks article is divided into three sections with sentiment indicators, using options open interest and conclusions.

I. Sentiment Indicators

Tuesday saw a sharp drop in bearish sentiment putting both the overall Indicator Scoreboard and the Short Term Indicator in the SELL position, but the action of the next few days resulted in a sharp reversal in sentiment.


The Short Term Indicator (VXX $ volume and Smart Beta P/C) using S/T EMAs has also given a short term BUY, with the huge spike in VXX volume, which recently has resulted in new highs.


To make matters more interesting, the very short term outlook for the BKX which had been leading the DJIA down and last week saw many analysts project short term lows in the 74-5 range now shows a BUY. Opposite to the Feb-Mar period which was mostly in the SELL range, the multiple BUYs now could indicate continued strength.


pre-Conclusion for SPX.  Admittedly my personal bias is bearish longer term and a longer topping period with the semblance of a H&S is my hope, but I rely on sentiment for shorter direction.  That being said, I weight the immediate drop to SPX 2300ish at only 10% with a move to 2400 before dropping at 45% and to 2415 also at 45%.

Looking at bonds (TNX) a drop in rates to the bottom of the recent trading range has only resulted in a small reduction in bearish sentiment, so still neutral in direction.


For the gold miners (HUI), it looks like higher prices are still ahead as sentiment has not yet dropped to the SELL level.


II. Using Option Open Interest (OI)

For over a year I had been reading the free weekend updates of SassyOptions so I am not sure why this week I decided to try my own, but after recommending the weekend report on Twitter, I set up a spreadsheet version in Excel posting several updates online Mon & Tue.

The first chart I set up was for the May monthly (wrong in title) option interest for the SPY.  The chart indicates the puts (red) were pushing upwards to 240 while the calls (green) were pushing downward with convergence at 240.  These act much like the EW pivot points or as support/resistance zones.  As prices continued to hold around 240 on Tue, I noticed a put/call imbalance for Wed/Fri with p/cs at .76 and 1.1 respectively, so I expected a 5-10 pt drop for SPX Wed then a rally back to 2400 (SPY 240) Fri.  At 8am EST on Wed futures were down 6-7 pts and held there to 8.30, so I thought I had guessed right, but when the east coast banks opened at 8.30am futures started dropping and quickly fell to down 20.  What I had failed to realize was that there was no support below SPY 240 and after opening quickly dropped to 237 with the SPX closing at 2357.  What happened was something called "delta hedging" which is simply a form of portfolio insurance, aka 1987, where a drop below a certain range that seemed to be 8-10 SPX pts forced the put writers to sell SPX futures to cover their losses which started a downward spiral in prices.


Why did it stop at SPX 2353 on Tue?  This is an updated chart of the one posted on Twitter for June that shows strong support at the SPY 235 (SPX 2350) level.  However, there is virtually no put support above 235 and below that no support until 230, so for June expy the expected range is 235-240, but a break below 235 could quickly fall to 230.


Next I want to look at next weeks Wed/Fri OI, remembering that contract size for Fri is about 50% of monthly and Wed is about 50% of Fri so influence is probably relative to contract size.

For Wed, convergence is at 239 with stronger call resistance above and less put support below so most likely range thru Wed is 238-39.


Fri tells a completely different story with strong put support at 237 and 239 while call resistance actually declines between 240.5 and 241.5, indicating that this is the best chance for a move higher to SPX 2405-2415 range.


pre-Conclusion for SPX.  OK, so there is no guarantee this will actually work, but it does look like there is a good possibility for a short entry Fri at a new ATH with a good chance of a decline to 2350 or if broken 2300 by June expy.

Application for the NDX using QQQ ETF.  This is an interesting example of "delta hedging" both ways.  Using the May OI, the QQQ should have been pegged to 138, but once it broke to the upside, there appeared to be no limit.  I began to think the NDX would continue rising until Musk announced plans to build a solar powered escalator to the moon.


The June OI tells a different story, as the Wed drop sent the QQQ all the way from the above call resistance down to the below put resistance.


I also tried a couple of others including the TNX, VIX and GDX.  There were no options for TNX, VIX was interesting with a medium size hump at 12 and a larger one at 15 which turned out to be key levels, but somehow the chart disappeared.  So the following is for the GDX June.  There is strong resistance at 24 and above with max put support at 22, so most likely range 22-24.  Watch out for delta hedging below 20.


III. Conclusions.

So we covered two sentiment approaches this week, my normal approach does not show a clear path with a short term BUY and an intermediate stronger SELL.  One resolution which I posted on Twitter is an analog to mid-June 2016 when we had a similar sharp rise in VXX volume.  What is shown is the EW preferred scenario where sentiment spiked high enough on the second decline (now SPX 2300 or below) to support a rally to ATH.  Possible, but I prefer a more bearish LT resolution which would probably mean alternation (we had sharp decline, so next phase more gradual) or an ATH and consolidation to work off bearish sentiment then decline.


The use of option open interest supports the bearish outcome as a possibility with a possible rally late next week over SPX 2400 with more decline later into June.

Weekly Trade Alert.  This even harder than last week which did turn out to be the correct path.  Assuming SPX consolidates between 2380-90 Mon-Wed, a run above 2400 Thu-Fri seems likely as bears get antsy. Short SPX 2415ish, Stop 2425.  Target ST 2350, IT 2300. Updates @mrktsignals.

Article Index 2017 by Topic
Article Index 2016 by Topic

© 2017 SentimentSignals.blogspot.com

Saturday, May 13, 2017

Running Out of Time

For several weeks I have been looking for at least an intermediate term top around mid-May and next week is it.  Previously, I thought a moderate push over SPX 2400 was possible, but we are now running out of time given current sentiment.  Next week could see a push up to 2405, but I will be shorting SPX 2400 if not breached early in the week.

Bearish sentiment has continued to fall even as prices retreated last week.  Looking first at the overall Indicator Scoreboard, bearish sentiment has almost reached the official SELL region, lower than it was in the July and Dec 2015 periods.


The Short Term Indicator (VXX $ volume and Smart Beta P/C) with intermediate EMAs reached the SELL level again after a short bounce early in the week.


Next, I want to look at the Short Term Indicator components for a clearer picture of what to expect.  First, the VXX $ volume has been very low now for several months similar to the mid-2015 period, which may indicate a spike in volatility is near.


Second, the Smart Beta P/C (ETF puts/equity calls) has been one of the most reliable indicators, remaining at warning levels since the first of the year, but refusing to decline to the SELL level.  The last two weeks have seen a breakdown from that range with more decline likely before a SELL is reached.  One scenario that seems to fit the two components is a short, but sharp drop down to the SPX 2320-50 area, possibly by early June, then a rally back to 2400, possibly thru EOM June, then a 7-8% correction down to 2200 by late Sept.


Moving on to bonds (TNX), as rates have risen and are now consolidating in the 2.3-2.4% area, bearish sentiment for bonds continues to fall indicating that higher rates are likely ahead at some time.


Finally with gold stocks (HUI), bearish sentiment has fallen sharply with the most recent rally.  I want to inspect this more closely using a shorter term chart.


Using shorter term EMAs from Jan 2016, one can see that a continued rally towards the 210 level, possibly as a safe haven if stocks decline, is likely to set up a SELL with a decline at least as strong as the Feb decline and maybe more given the longer term view.


Conclusion.  Stocks appear to be struggling, so next week I am looking for a high in the range of 2398-2405 if not exceeded by Wed.  Intraday for clues I watch CBOE intraday put/call here, as you can see very low AM but higher in PM supported strong close, as well as VXX real time $ volume, which dropped to 40% of avg Wed before the Thur flush, then more than doubled Thur with about half in late trading.

Weekly Trade Alert.  One by one the indices seem to be rolling over with the DJTA leading the way, followed by the BKX that is pulling the DJIA down, so that last weeks high by the NDX and SPX looks like a non-confirmation.  Tough making a call here, but I think a top may be in by Wed between SPX 2398-2405.  If P/Cs are weak market may not hold up thru Friday.  Tenatively, Short 2398-2405, Stop 2420, Target 2320-50. Updates @mrktsignals.

Article Index 2017 by Topic
Article Index 2016 by Topic

© 2017 SentimentSignals.blogspot.com

Saturday, May 6, 2017

All Eyes on the French Election

Last week, I was looking for a top in the SPX around 2400, near the Friday close, but on Twitter warned to wait for a "pump and dump" after the French election.  At SPX 2380 early in the week, I thought we might each 2405, but after the Wed debate favoring Macron moved the SPX to 2390, 2410 seemed more likely, and finally the Friday close near 2400 has me looking for 2415.  I've noticed in the past that moves in Europe result in about half the percentage change for the US markets, so SPX 2415 may result from a 1.5 to 2.0% change in Europe.   Obviously, the move late in the week has reflected part of the change.

Moving on to sentiment the biggest change was Monday's 13% drop in the SKEW from 147 to 128, which lowered the expectations for large price moves as we saw in the weekly range of 2379-2399.  So the expected drop of 3-4% may take from mid-May to mid-June.

Looking next at the SPX sentiment indicators from Jan 2015, the Indicator Scoreboard since last Oct has repeated the sentiment pattern from Jan to July and Nov-Dec 2015, but the TRIN is not as excessive and the recent drop in the SKEW points to less volatile declines than from the 2015 tops.


The Short Term Indicator (VXX $ volume and Smart Beta P/C) with intermediate EMAs has now fully reached the SELL level, last seen in Nov 2015.  This plus the Indicator Scoreboard reading indicate that an initial 3-4% decline may not be sufficient for a strong bottom.


The additional chart for the SDS/SSO ETFs seems to support this idea with low bearish sentiment since July 2015.


Sentiment for bonds (TNX) has stabilized near the mean so rates may stabilize until mid-June if the SPX corrects.


Gold stock sentiment (HUI) remains low even after the HUI testing the recent lows, so it's unclear whether the HUI can bounce to the 200 SMA (200-205) if stocks correct, then crash, or whether it just continues downward.


Conclusion.  Stocks (SPX) are likely to move lower after making an ATH next week and may be making a final top depending on how sentiment looks after a decline.  If the SKEW remains low and the decline is gradual, we may only get a big yawn from the bears and stocks may find themselves in a situation similar to the HUI.

Weekly Trade Alert.  Ideally, I will be looking for a SHORT at SPX 2415 (range 2410-2420) based on Europe's reaction to the French election.  Target is SPX 2320-2330, Stop 2430.  Based on Friday's symbolic levels (DJIA 21K, SPX 2400) the top may carry over into Wed-Thur. Updates @mrktsignals.

Article Index 2017 by Topic
Article Index 2016 by Topic

© 2017 SentimentSignals.blogspot.com

Article Index, 2017 by Topic

2016.12 Long term forecast. What Happens When Growth Returns?
2017.01 #1 Expecting strong start to year, weakness later with higher s/t rates. Start BKX FAS/FAZ.
2017.01 #2 Indicator Scoreboard at SELL as DJIA crosses 20K. S/T Indicator holds above SELL.
2017.01 #3 Not expecting reflation rally until mid-2018. HUI nears SELL.
2017.01 #4 SPX and NDX ETFs bearish sentiment at lowest level in several years.
2017.01 #5 Looking at TRIN and VIX P/C do not see signs of significant top yet.
2017.02 #1 SPX topping pricess may continue. Gold stocks and bonds nearing SELL.
2017.02 #2 SPX may top out at 2390. Gold stocks on SELL HUI at 220.
2017.02 #3 L/T Indicator Scoreboard very bearish, but S/T Indicator refusing to show SELL.
2017.02 #4 Trump reforms delayed. VIX P/C and TRIN moving to bearish.
2017.03 #1 SPX bubble continues. HUI crushed as rates rise.
2017.03 #2 Market pressure may appear by mid-May. Bonds and HUI may bottom S/T.
2017.03 #3 Using the SKEW as indicator of large price moves, up and down,
2017.03 #4 Buy on S/T Composite & high SKEW indicate large move up for SPX likely.
2017.04 #1 EOQ windiw dressing starts rally, but sharp drop in bearishness.
2017.04 #2 Overall long term view of ETFs contradict consensus growth/inflation views.
2017.04 #3 BUY for Indicator Scoreboard and high TRIN point to final rally. Inverse HUI and TNX moves continue.
2017.04 #4 Using VIX P/C and TRIN composite shows high risk of >= 3% decline in SPX.
2017.04 #5 Nearing a SELL on SPX, possible SPX 2400+ at FOMC for top.
2017.05 #1 Possible top after French election, but lower SKEW indicates slow drop.
2017.05 #2 Very low VXX $ volume warns of probable drop SPX 2320-50 w/retest ATH by EOM June.
2017.05 #3 Mid-week drop to SPX 2350 gives ST Buy, expect 2400+. Intro to Options open interest.
2017.05 #4 SPX may remain over 2400 for a while, 7-8% pullback likely Jul-Sep. GDX options indicate 22-4 range.
2017.06 #1 SPX no signs of Sell, bonds near Sell, HUI neutral. Options show SPY 243-4 possible.
2017.06 #2 SPX overall indicator at Sell, but not smart beta p/c. Possible July top. Sell on TNX at 2.2%. Options GDX 22-4.
2017.06 #3 SPX bearish sentiment rising to neutral w/tech volatility. Options for July show resist at SPY 247. Similarities to 2014 for SPX.
2017.06 #4 SPX sentiment below neutral but NDX at Buy. Options - July 21 best prob of move to SPY 247, Sept 15 poss drop to 235. 3 volume indicators - high risk, capitulation, buy/hold/crash.
2017.07 #1 Rise in bearish sentiment may support SPX 50-75 pt rally from 2405, NDX sentiment extreme. Options using VIX monthly shows poss sharp vol rise into Sept 15.
2017.07 #2 SPX flat for week but volatility increased sentiment over neutral. Option open int show modest SPX strength to mid-Aug, QQQ strong support.
2017.07 #3 Strong rally lowers SPX sentiment, NDX sentiment points to new highs.
2017.07 #4 Overall sentiment pts to nearing top. NDX possible to 6000. VIX call indicator. Options int - down mid-Aug-Sep, up to mid-Oct.
2017.08 #1 Nearing major top. TA pts to SPX 2485-95 int top (act 2491), int target 2400, st SPY < 246.
2017.08 #2 Rapidily rising bearish sentiment likely to prevent drop to 2400. Rally to SPX 2480 possible. SPY target 246/7. VIX call indicator BUY.
2017.08 #3 Looking for SPX low 2405-15 (act 2417), possible rally into Labor Day to test ATH. HUI sentiment improving.
2017.08 #4 Bearish sentiment now at very high levels for SPX, HUI sentiment more positive.
2017.09 #1 Bounce as predicted, very high ST Indicator likely to result in 2-3 mn range 2450-2500.
2017.09 #2 Overall sentiment neutral, but high STI means more gains likely.
2017.09 #3 LT indicators show major top ahead, STI pts to SPX 2540-50 mid-Oct, Qtrly OI shows pullpack Nov-Dec low SPX 2400s.
2017.09 #4 Money flow (ETF) indicators pt to LT top ahead across asset classes. VIX call ind rising but no sell.
2017.09 #5 No change for most sentiment, but felling déjà vu to late 2015. VIX calls give SELL, may tie to NK holidays Oct 10/18.
2017.10 #1 VIX call indicator showing a sell, but ST Indiator only at neutral.
2017.10 #2 ST Indicator nowhere near a sell. Comparison to 2015 may indicate top early Nov near SPX 2600.
2017.10 #3 Upside targets reached, but persistent bearishness supports higher prices.
2017.10 #4 Possible small pullback then rally to SPX 2600, larger pullback by options exp.
2017.11 #1 Some sentiment measures show top may be near, but high VXX $ volume show top may be farther away than expected.
2017.11 #2 Expecting choppy week then move to SPX 2600+ early Dec, low SKEW means low risk of large decline. Bonds show rising bearishness that may be smart money.
2017.11 #3 Prior weeks choppiness has pushed up bearishness to level consistent with SPX 2600+ by early Dec.
2017.11 #4 More upside is likely before a pullback into mid-Dec.
2017.12 #1 Recent spike in VXX $ vol shows bears too eager, with very low revised CPC pt to a few more weeks of rally to SPX 2700+ into Jan, then 5-7% correction.
2017.12 #2 ST Indicator still positive with strong NDX upside sentiment, bonds pointing to upside breakout w/TNX 2.7-8% problem for stocks.
2017.12 #3 Consensus of SPX 3000 by EOY pts to meltup/meltdown or failure. Bond sentiment pts to higher rates.
2017.12 #4 No Santa rally points to Jan upside surprise. Early Jan over SPX 2700 w/ possible pullback to mid month.
2017.12 #5 Overall Indicator signals INT top near, ST Indicator says not yet. Mixed signals with weak close.