
Over the past two weeks, I pointed to similarities to the 2008-09 period, but now many are looking at market action in reaction to the extraordinary stimulus from both the Fed's QE-finity and massive fiscal bailouts as the beginning of a V-bottom similar to the Mar 2009 lows. My approach is to first look at sentiment using a variety of measures and then look for price patterns with similar sentiment. Sentiment is still most similar to that of the first down leg in Oct 2018, implying that the worst is still to come.
Last week, I showed that the extreme low of the McClellan Summation Index (-1200) was comparable to the July 2008 low. Two weeks ago, I compared the Feb-Mar 2020 decline to that from Oct 2007 to Jan 2008 with an accelerated time frame of about 1 day in 2020 equal to 1 week in 2007-08. Last weeks three day rally comprised a similar 38% retracement to the two week rally off the Jan 2008 lows. Charts and more in Tech/Other.
I. Sentiment Indicators
The overall Indicator Scoreboard (INT term, outlook two to four months) bearish sentiment has only begun to decline. Both the early and late 2018 sharp decline were followed by retests or lower lows. Sentiment appears to be similar to that of early Oct 2018 before the Nov trading range of SPX 2600-2800.

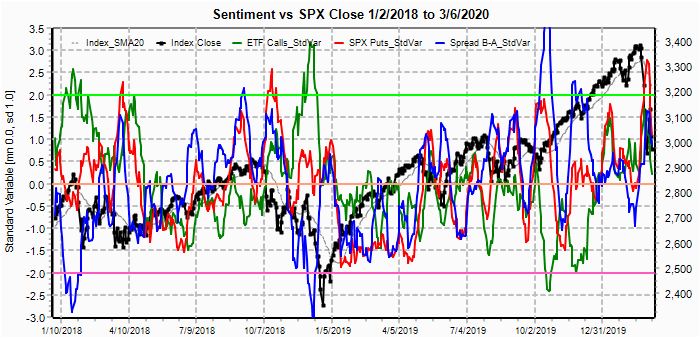
The INT view of the Short Term Indicator (VXX $ volume and Smart Beta P/C [ETF Puts/Equity Calls], outlook two to four months) bearish sentiment (SPX vol adjusted) never reached the levels seen in the two major selloffs of 2018, but is also now in the range of Oct-Nov 2018.

One adjustment that I made several years ago to the VXX $ Vol after the Jan 2016 decline was to adjust for SPX daily volume since the low Dec 2015 vol distorted results. For Feb-Mar 2020 SPX volume has been very high and may have understated VXX $ Vol and the following chart is unadjusted. Here, we see that VXX $ Vol composite did slightly exceed the Oct 2018 decline but also never reached the extremes of Feb and Dec 2018.

Bonds (TNX). Bond investors seem to be "All in", but with backing by the Fed with the announcement of QE-finity, downside price risk seems low as long as inflation risk is low.

For the INT outlook with LT still negative, the gold miners (HUI) bearish sentiment briefly rose to the INT BUY level early in the week, but the ST 50% retracement rally sent sentiment back to the SELL area.

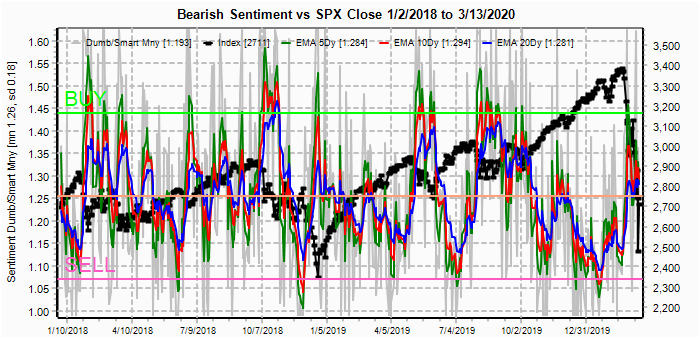
II. Dumb Money/Smart Money Indicators
The option-based Dumb Money/Smart Money Indicator as short/INT term (outlook 2 to 4 mns/weeks) rose only moderately from the SELL levels of Jan 2020 and has now declined to the 1.1-1.15 levels showing a strong warning.

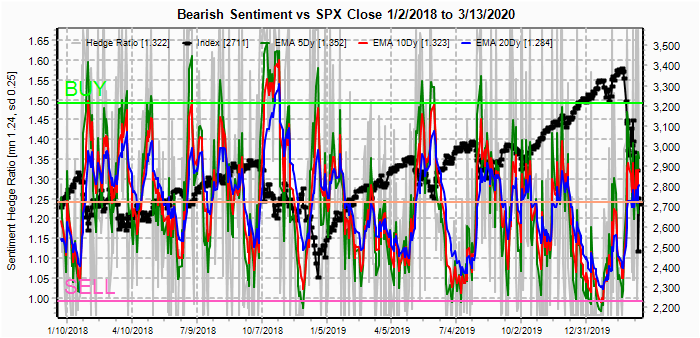
And the sister options Hedge Ratio sentiment is similar with a weaker warning from the 1.15-1.2 levels.

No SPX or NDX ETF charts this week.
III. Options Open Interest
Using Thur closing OI, remember that further out time frames are more likely to change over time, and that closing prices are more likely to be effected. Delta hedging may occur as negative reinforcement when put support is broken or call resistance is exceeded. Due to extreme volatility, this weeks outlook is EOM, Mar 31 and NFPR, Apr 3. Also, This week includes a look at the TLT for Apr exp.
With Fri close at SPX 2541, options OI for Tue EOM shows room for volatility between strong put support at SPX 2300 and 2570 with call resistance moderate at 2530 and 2550 and strong at 2590. Whipsaw between 2400 and 2600 is possible.

NFPR Fri has Smaller OI with most positions hedged (calls and puts offset) down to put support at SPX 2350. A drop below 2400 is possible.

Using the GDX as a gold miner proxy closing at 23.47, last week showed put support at 23 and 25-7 with call resistance at 24 and 28. GDX rose from 21 to 27 before falling to support.
Currently the TLT is 167.7 with the TNX at 0.75%. There is very strong call resistance at 175 with very little unhedged put support. Prices could fall to 150, but given economic uncertainty prices should remain in the 160s.

IV. Technical / Other
This is an updated weekly chart from 2008 which shows a five wave decline (EW) from the Oct 2007 ATH to the Mar 2008 lows. Note the extremely sharp w4 of A down late Jan which was a 38% retrace of w1-3 similar to last weeks 3 day retrace rally of 37%. What followed was a w5 retest/lower low. Using a similar timeline with 1+ day in 2020 to 1 week in 2008 implies a decline into mid Apr before a larger 50% retrace rally, note timing is likely to vary going forward. A decline to about 2100 would imply a retrace rally of A to about SPX 2750.

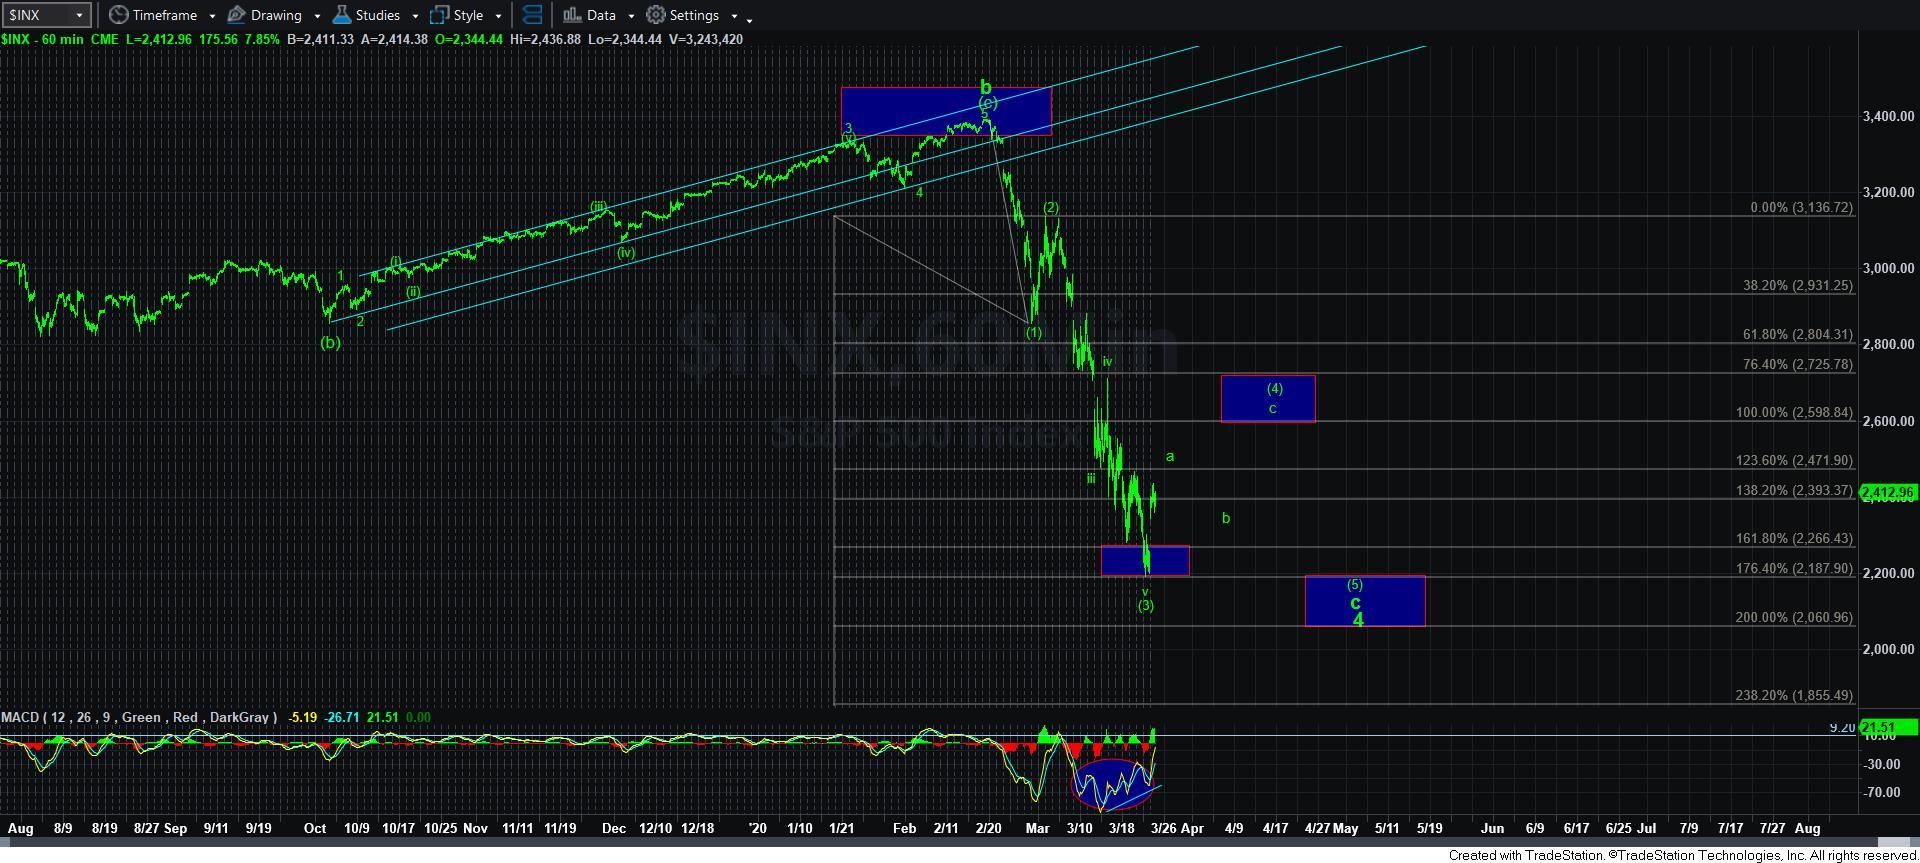
Although I disagreed with Avi Gilbert prior to the Feb top when his primary count was for a continued rally into the Fall to SPX 3700 because sentiment strongly implied a 30-40% decline was more likely. His latest public outlook shows a similar price pattern with a w4 top between 2600 and 2725 with an expected w5 low between 2060 and 2190 (SPX 60 min).
Conclusions. A lower low for the SPX in the 2050-2190 area may be the best oppty for a swing trade since the current decline began in Feb. With many of the declines and rallies since Feb beginning with large gaps of 50% or more of the entire move, it was impossible to provide any meaningful outlook with weekend posts, and to tell the truth I spend most of my free time grocery shopping now that it takes 2-3 trips to find everything you are looking for. The next two weeks may be very important in determining the nature of the current selloff, since a 5 wave decline in EW implies the next opposite move is corrective and probably means we are in the beginning of a larger bear market.
Weekly Trade Alert. A lower low by mid-Apr is likely when firms start releasing their forward earning guidance that are likely to be awful. A reprieve with summer weather may usher in a "summer rally" and a 50% rally of the entire decline similar to that seen in Apr-May of 2008, especially if Covid-19 takes a breather. Updates @mrktsignals.
Investment Diary, Indicator Primer,
update 2020.02.07 Data Mining Indicators,
update 2019.04.27 Stock Buybacks,
update 2018.03.28 Dumb Money/Smart Money Indicators
Article Index 2019 by Topic, completed thru EOY 2020.02.04
Article Index 2018 by Topic
Article Index 2017 by Topic
Article Index 2016 by Topic
Long term forecasts
© 2020 SentimentSignals.blogspot.com


