Has Avi now joined the darkside? I was surprised to see that Avi's missive this week at Muck Rack is now predicting a rally to new ATH by the end of this year or early 2020 before a large decline and is even claiming to have been following a "2015-16 fractal" all along. Compare this to his mid-Sept letter were he was proclaiming that the SPX would pinball down to the 2200 level. I now wonder if I should start to worry that my views have become the consensus, although a glimmer of hope is offered by Mark Hulberts recent post that the recommended equity exposure by ST timers is well below that seen at recent ST tops.
Several of the data mining indicators are updated in the Tech/Other section, and below is an update of where we stand relative to 2015 that still seems to be chugging along at about a 2x time frame.

I. Sentiment Indicators
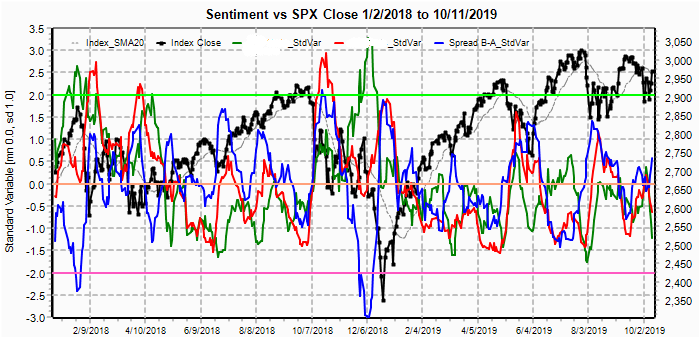
The overall Indicator Scoreboard (INT term, outlook two to four months) bearish sentiment saw a sharp drop last week that might be comparable to early Aug 2018.

The INT view of the Short Term Indicator (VXX $ volume and Smart Beta P/C [ETF Puts/Equity Calls], outlook two to four months) bearish sentiment continues to show a pattern of lower lows comparing the Jan and Oct 2018 tops to today that last for a longer period but are followed by larger declines.

Bonds (TNX). Interest rates seem to be consolidating between 1.5% and 2.0% and may continue to do so for several months until economic uncertainties are resolved. Low bearish sentiment indicates this could be a major bottom forming.

For the INT outlook with LT still negative, the gold miners (HUI) bearish sentiment is low, but the same uncertainties keeping int rates low may keep gold stocks elevated.

II. Dumb Money/Smart Money Indicators
The option-based Dumb Money/Smart Money Indicator as short/INT term (outlook 2 to 4 mns/weeks) really took a nosedive last week after languishing above neutral for several weeks, but LT EMAs (blue) are likely to work lower before major problems.

And the sister options Hedge Ratio sentiment is much the same, but less extreme. Small risk of large volatility spike at the moment.

The INT term SPX Long Term (2x/DM) ETFs (outlook two to four weeks) bearish sentiment has been steadily falling.

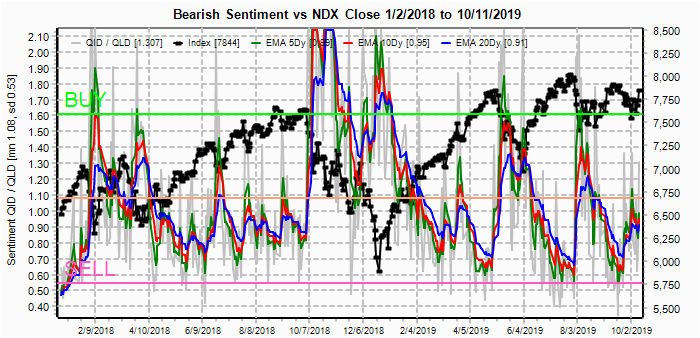
The INT term NDX Long Term (2x/DM) ETFs (outlook two to four weeks) bearish sentiment has now reached the danger level as the NDX finally made new highs, mainly on the strength of AAPL. AAPL's earnings come out on the 30th after the close and may produce a "sell the news" event.

III. Options Open Interest
Using Wed close, remember that further out time frames are more likely to change over time, and that closing prices are more likely to be effected. This week I will look out thru Nov 1. Also, This week includes a look at the TLT Nov 15 opt exp.
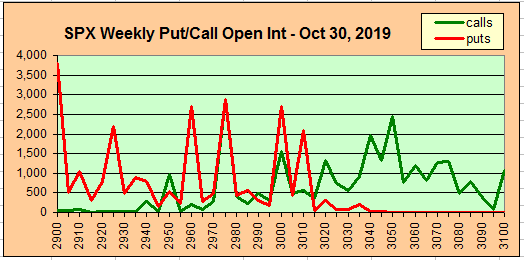
With Fri close at SPX 3023, the SPX was able to power thru call resistance the last two weeks and now has put support over 3000. Call OI at SPX 3025 could hinder further progress, but over 3025 and 3040 is possible with put support at 3010.

Wed is much the same with put support up ro SPX 3010 and over 3020 next call resistance is 3040-50.
For EOM Thur 31st, a "sell the news" seems likely after Wed FOMC and APPL EPS, SPX 3000 possible.

For Fri, Nov 1 jobs report, shows solid call resistance over SPX 3025 with overlapping put/calls down to 2975 that could allow for increased volatility.

Currently the TLT is 138.5 with the TNX at 1.8%. The huge put support for Oct 18 at 139 kept prices between 138-140, having broken below the Nov 15 141 support level, next major support is 137 then 135, so prices are likely to gradually fall further.

IV. Technical / Other
First, a look at the Crash Indicator from Jan 2018 where bearish sentiment has dropped to neutral, similar to Aug 2018.

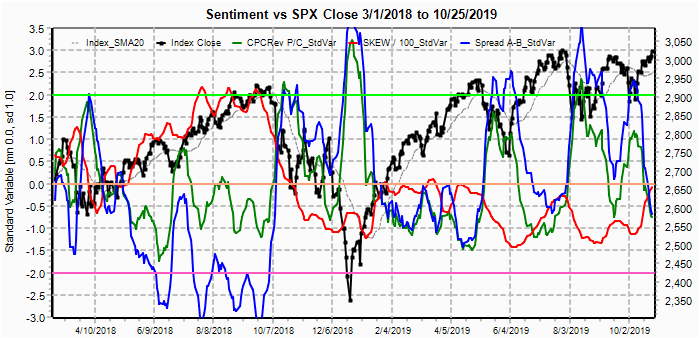
Next an update of the SKEW relative to overall sentiment (CPC Revised) saw a sharp drop indicating that even though bearish sentiment dropped sharply, the risk of a spike in volatility remains high. A negative trend but not at dangerous levels yet. Due ro VIX blowup in Feb 2018, data for SKEW and VIX optns starts Mar 1, 2018.
The VIX put volume relative to overall sentiment two weeks ago may be why there was little progress to the upside until volume subsided.

While VIX call volume has remained weak relative to sentiment and has provided support for higher SPX prices even though VIX puts provided a negative influence. No meaningful downside is expected while VIX call buying is this low. Dec 2018 was an exception, but was made up for by the Crash Indicator.

Conclusions. Options OI indicate that a very ST top may occur Wed with a high of SPX 3060-50 possible, but a pullback. is likely to be limited to 3000. Other indicators are pointing to a more meaningful decline possible the second half of Nov. The SPX may even reach 3070-80 first, but we should see a spike in the VIX call volume before a possible test of the mid-Oct SPX gap at 2940.
Weekly Trade Alert. With FOMC and APPL EPS after the close scheduled for Wed, watch for a possible "sell the news" reaction of a 1-2% pullback. Updates @mrktsignals.
Investment Diary, Indicator Primer, update 2019.04.27 Stock Buybacks, update 2018.03.28 Dumb Money/Smart Money Indicators
Article Index 2019 by Topic
Article Index 2018 by Topic
Article Index 2017 by Topic
Article Index 2016 by Topic
Long term forecasts
© 2019 SentimentSignals.blogspot.com