
When I first discussed the possibility of a melt up/bubble in stocks in June 2017, little did I know that the SPX would be 20% higher seven months later. In August 2017, we saw extreme bearish sentiment in the ST Indicator rivaling the 200+ pt flash crash in Aug 2015 when the SPX dropped 75 pts to retest the 2400 level and the melt up began. Believe it or not, last week saw an NDX sentiment indicator rise to levels similar to the Aug 2015 flash crash, even as 7000 was tested. Is the NDX about to see a redux of the melt up the second half of 1999?

I. Sentiment Indicators
The overall Indicator Scoreboard remains near recent lows with slight uptick early in the week.

The Short Term Indicator (VXX $ volume and Smart Beta P/C) is also relatively unchanged.

The NDX short term ETFs SQQQ/TQQQ sentiment continued to spike higher reaching the strong BUY level that rivals that of the Aug 2015 flash crash. Last week I read in ZH that Soros had lost $1B shorting the "Trump rally", perhaps he has now shifted focus to the NDX. The daily $ size of the SQQQ volume is only 10% of the VXX $ vol, so it is hard to gauge the possible price effects, but I estimate 5-10% addl upside for the NDX over the next few weeks/months.

But the longer term NDX ETFs QLD/QID is showing what appears to be a rounded bottom in sentiment similar to the first half of 2015 that may indicate we are near the terminal phase of the rally not the beginning of a long term move.

Bond sentiment (TNX) dropped slightly as rates hovered around 2.65%.

The gold miners (HUI) sentiment fell slightly as prices saw a strong start to the week on a weaker dollar, then fell back as the GDX approached the 25 resistance level of the options OI.

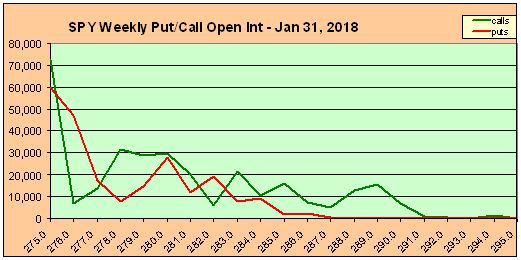
II. Options Open Interest
For the past several weeks options OI as not been effective for SPY guidelines as small pickups in regular bearish sentiment measures have acted like sparks during late fall in the California wooded areas easily starting huge wildfires. For next week for the SPY (close 286.6, SPX 2873) on Wed Jan 31, SPY 287 looks like a comfort zone with higher call levels on either side, so Mon/Tue may be relatively calm. If resistance at 288-9 is over come, there is clear sailing to higher levels. "Most likely" is 282.5.
For Fri Feb 2, "most likely" is SPY 282 and as long as prices hold over 285, a move to 295 or higher is possible.

III. Technical Indicators
Over the last two weeks, I have noticed a sharp drop in the SKEW and looked back over several years and noticed a pattern that seems to be repeating from the lead up to the 2007 market top. Namely, a pattern of rising tops and bottoms in the SKEW for most of the bull market as bearish sentiment increases with higher prices, followed by a sharp decline as the bears go into hibernation at the top. We still have a little ways to go before reaching 2008 levels.

Conclusions. Pullbacks are getting smaller and smaller as prices go parabolic, so buy the dip is quickly becoming chase the rip. Higher prices are likely next week, but there may be some hesitation Mon/Tue ahead of the FOMC as some are warning of a "surprise" rate hike. I doubt the new Fed head is anything like Paul Volcker (broke 1970s inflation), and a dovish outcome could push the SPX towards 3000 latter in the week. The NDX should be especially strong with large cap tech earnings coming out combined with the bullish SQQQ/TQQQ sentiment. A move to SPX 2970-90 will likely be followed by a 3-5% pullback into mid-late Feb (target SPX 2850ish), but should be followed by one more push higher of 5-10% targeting SPX 3100-200.
Weekly Trade Alert. Waiting for a pullback is becoming frustrating, so a flattish start to the week is likely going to be followed a strong second half. Use your own discretion. Updates @mrktsignals.
Investment Diary, update 2017.10.28, Indicator Primer
Article Index 2017 by Topic
Article Index 2016 by Topic
© 2017 SentimentSignals.blogspot.com


