Somebody must have taken the title of my last post seriously about techs roaring back since the NDX rallied 5%, matching the early Dec highs at 12,170 with similar blowoff vol of 1.4B shares. The next several weeks in Dec, however, the NDX fell 10%. Meanwhile although I have been shouting that the consensus was too bearish with calls for an imminent recession, it looks like I was not bullish enough with targets for the SPX by EOM of 4030-50. Apparently, many technicians have been focused on the declining tops TL since early 2022 that came n around SPX 4000, and the breakout sent the bears running for cover with a spike up to 4090. I still think a multi-week decline of SPX 200+ pts is likely to start by early Feb. Possibly, due to a still hawkish Fed on Wed and a strong jobs report on Fri. Bond sentiment is indicating that int rates (TNX) should start rising soon.
I ran across an interesting chart showing a close correlation between the SPX and liquidity measured by a combination of the Fed's B/S, Treasury account and O/N reverse repos as shown in Tech/Other.
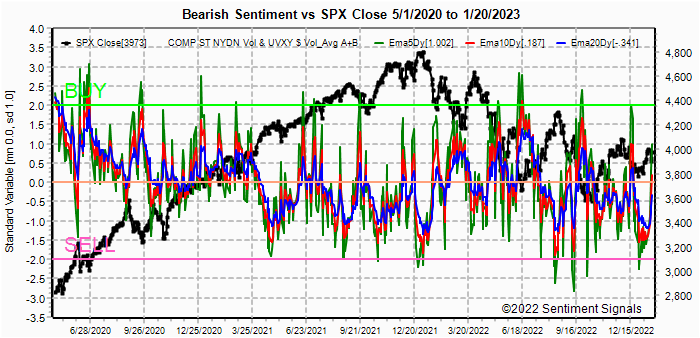
I. Sentiment Indicators
The INT/LT Composite indicator (outlook 3 to 6+ months) has three separate components. 1st is the SPX and ETF put-call indicators (30%), 2nd the SPX 2X ETF INT ratio (40%), and 3rd a volatility indicator (30%) which combines the options volatility ratio of the ST SPX (VIX) to the ST VIX (VVIX) with the UVXY $ volume.
Update Alt. In this case the wts for the SPX 2X ETF ratio (SDS/SSO) and SPX puts & calls spread are adj to equal as in the DM/SM section for SPX ETFs.
Sentiment dropped last week, lead by the SPX ETFS and volatility, below the recent ST top.


Update. Little change here, and the recent Sell is still in effect.

Update EMA. The blip up shown in last weeks report proved prescient, but has now reversed.

Update EMA. Bearish sentiment is reaching the pt where a multi-week decline in SPX is likely.


Update. Sentiment is mostly unchanged.

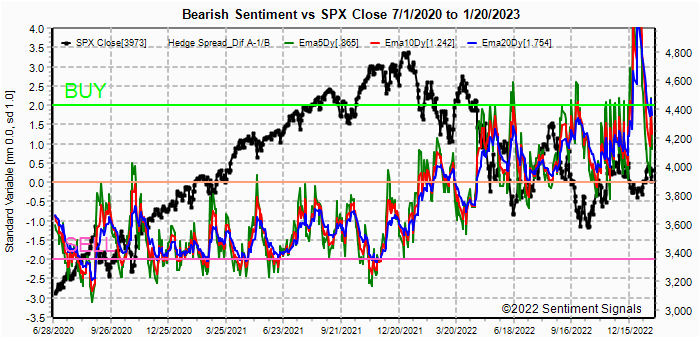
II. Dumb Money/Smart Money Indicators
This is a new hybrid option/ETF Dumb Money/Smart Money Indicator as a INT/LT term (outlook 2-6 mns) bearish sentiment indicator. The use of ETFs increases the duration (term).
Update. Sentiment continues to hover near the recent lows, indicating that the recent breakout is unlikely to be the beginning of a new bull phase.


Update. Sentiment continued to fall, but remains
positive.

III. Options Open Interest
Using Thur closing OI, remember that further out time frames are more likely to change over time, and that closing prices are more likely to be effected. Delta hedging may occur as reinforcement, negative when put support is broken or positive when call resistance is exceeded. This week I will look out thru Feb 3. A text overlay is used for extreme OI to improve readability, P/C is not changed. A new addition is added for OI $ amounts with breakeven pts (BE) where call & put $ amounts cross.
With Fri close at SPX 4071, options OI for Mon is small and some downward pressure should be seen between 4000-50.


IV. Technical / Other
Last week I ran across a chart at another site which bears (pun) mentioning. It was posted by a Fidelity Wealth Account manager and shows the SPX vs total liquidity ( Feds B/S - Treasury Gen Acct - O/N reverse repos). The chart speaks for itself. The author's (J.Trimmer) outlook for 2023 is for a sideways chop, similar to my own. I haven't had the time to research the data, but it is probably available at the NY Fed.

Conclusions. Declines in bearish sentiment indicate that a top is expected soon and may have occurred last week ST. However, INT sentiment indicates that a sharp decline is unlikely and that a rounded top may form and could stretch the expected correction into mid-Mar. The spike high could raise the lows of a correction to the SPX 3850-3900 as I only see a 5-6% correction likely.
Weekly Trade Alert. Not much guidance for next week as I was not bullish enough last week and a range of SPX 4000-50 seems likely. Updates @mrktsignals.
Investment Diary, Indicator Primer, Tech/Other Refs,
update 2021.07.xx Data Mining Indicators - Update, Summer 2021,
update 2020.02.07 Data Mining Indicators,
update 2019.04.27 Stock Buybacks,
update 2018.03.28 Dumb Money/Smart Money Indicators
Article Index 2019 by Topic, completed thru EOY 2020.02.04
Article Index 2018 by Topic
Article Index 2017 by Topic
Article Index 2016 by Topic
Long term forecasts
© 2022 SentimentSignals.blogspot.com