This weekend I was watching a Brad Pitt movie from a couple of years ago called "World War Z", one of the many zombie apocalypse movies over the last few years. Two things struck as similar to modern day economics, the first is the contagion of modern day central banking and the second is the Israeli "tenth man rule". Israel was the only country to anticipate the contagion by agreeing to use a committee of ten decision makers where nine agreeing on one outcome would default to the decision of the contrary vote. Is there more than one of ten that does not agree that much higher prices are ahead?
Most of my indicators are repeating a pattern seen between May and July of 2015. This weekend I will follow a pattern starting with the individual indicators and conclude with the composites. First is the VIX P/C which is an almost identical position to early May 2015, where blossoming bearish sentiment (low VIX P/C) saw a last gasp rally to new highs. Capitulation by the bears was shown by a spike in the VIX P/C.
The Short Term Indicator (VXX $ vol & Smart Beta P/C) continues to show similarity to the July 2015 period, pointing to less upside potential and a shorter consolidation period ahead. The money flow indicator SPXU/UPRO is very similar to the Short Term Indicator, having retreated to slightly below the mean.
The overall Scoreboard Composite is somewhat in between the two indicators show above, but shows that this is not the time to be overly complacent.
Conclusion. The topping process continues. September's high volume on a pullback is somewhat bullish short term, but the lack of a panic low makes me suspicious of the sustainability of any rally.
Weekly Trade Alert. Long entry target was not meet last week, and I prefer to hold off and look for a good shorting opportunity which could come over the next two or three weeks.
Most of my outside projects are nearing completion, so I will be able to devote more time to analyzing sentiment trends. Of note last week, the bearish levels of the Short Term Indicator components (VXX $ Volume and Smart Beta P/C) soared, while the overall P/C ratios were more subdued (declining VIX P/C). Also, the SKEW has been accurately forecasting market moves rising to the mid 130s before a decline and dropping to the mid 120s before rallies, with Friday's close at 125 being short term bullish. I will also be looking at some of the ETF ratios including the SPXU/UPRO and DUST/NUGT.
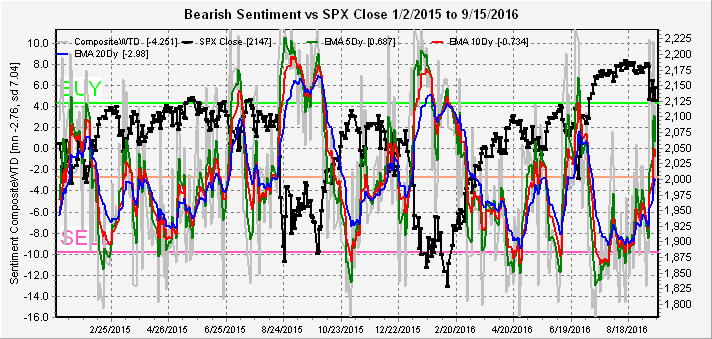
The overall Indicator Scoreboard continues to mimic the first half of 2015. Rising from a more extreme low, this indicator is approaching levels of the March 2015 decline and has increased almost as much as the early July 2015 decline.
The Short Term Indicator has risen more sharply with the medium term EMAs approaching the early July 2015 level. This indicates that a rally to test the ATH at SPX 2194 is likely to start next week.
Several times,I have referred to the SPXU/UPRO ratio as an excellent short term indicator and this time it seems to agree with the Short Term Indicator by showing behavior that mimics the July 2015 period. This points to the possibility of a fast and furious rally that is likely to fail.
For the last of the market indicators, the VIX P/C continues decline as expected, now approaching the equivalent of April 2015.
Finally, the gold miners ETF ratio DUST/NUGT. As it turns out, by waiting a couple of weeks, the effects of the double split worked themselves out so no smoothing was needed. This is definitely looking like a topping formation with a clear reverse mirror image to the last half of 2015.
Conclusion. It still continues to look like that by the end of the year gold miners, bonds and the general stock market will be in decline. For the general market the most likely period seems to be November for the final high which for now my guess is in an SPX range of 2185 to 2215.
Weekly Trade Alert. A rally is likely to start by mid-week. I doubt the FOMC will raise rates before the election, but even so, any decline is likely to be brief and shallow. Ideally, I want to go long at 2115 with a stop at 2100 and a target of 2185.
The weekend post is a day late, partially due to a busy schedule and waiting to see if there would be follow thru on Friday's decline. As I have been pointing out for weeks, my preferred scenario for a top was a Jan-May 2015 type top which saw a lot of volatility within a range of about 100 SPX points, but thru Thursday there was very little volatility. My indicators have been neutral for several weeks, so the sudden decline to SPX 2019 was unexpected other than a one day spike in VIX call buying on Thursday and a day later we are back to 2060. Still haven't adjusted DUST/NUGT for split.
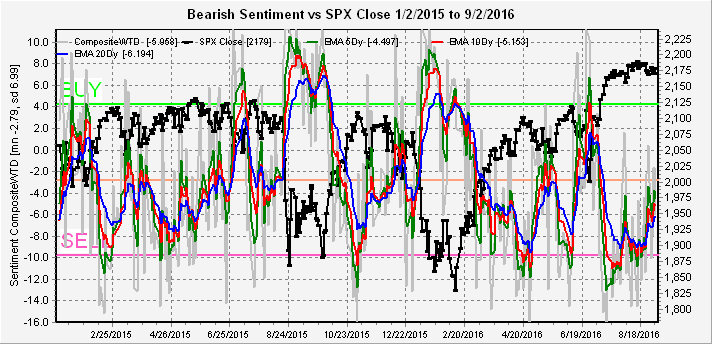
The overall Indicator Scoreboard (Friday) has spiked up to the mean, well within the early 2015 pattern. Overall, the timing seems to be like early May 2015 where a pickup in volatility occurred before the run to the May top. Also the significant decline did not happen until two months later in July, which would be equivalent to November 2016.
The Short Term Indicator was also stopped at the mean.
The VIX P/C EMAs are also locked in a very tight range, again similar to early May 2015 and are expected to drop before a more significant decline.
Conclusion. As you may have noticed my strength is not day trading, as I have found too often that whipsaws often catch you leaning in the wrong direction.
Weekly Trade Alert. Still not willing to make any commitment. Hopefully, I will be more focused when my outside projects are completed.
As expected, the Initial Unemployment Claims correctly forecast a weaker jobs report on Friday than last month with a resulting bounce from the 2160 area I expected. From a trading perspective, however, most of the week looked like distribution with early morning selloffs followed by slow rallies throughout the day, so I did not play the rally. Not much change in the indicators with mostly neutral readings. With football season beginning, I would compare this to halftime with the bulls ahead in the score, the only question is whether the second half will see a change in momentum.
The overall Indicator Scoreboard is little changed from last week.
The Short term Indicator has also flattened out with a slightly negative bias.
The VIX P/C is also little changed, hovering near the mean.
Conclusion. There is little reason for excitement, as the indicators continue to grind sideways in a pattern most similar to the first half of 2015. Still working on the DUST/NUGT splits, so no results until next week.
Weekly Trade Alert. The daily trading patterns last week kept me from going long at SPX 2160, but I doubt that the current rally exceeds 2185 for long and is likely to revisit the 2160 area soon. No trades for now.