Last week saw more volaility than expected as someone seemed to have decided to dump their bonds probably the Chinese, who had already sold about 30% during Trumps reign, but were hoping to see a more amicable Biden administration and when he continued Trumps trade war, decided to bail, pushing the TNX as high as 1.6%. The result was a 10% drop in the NDX, led by Teslas 30% drop, from 14k to below 13K as higher rates tend to threaten high growth sectors more.
My outlook from Feb 6 was that the the SPX was likely to retest the Jan lows, targeting 3750-3800, but short term I thought we could see strength into mid-week to 3930-50, but by Tue AM the NDX selloff took the SPX down to 3806 before rallying to 3930 Wed. A second retest of the low at 3790 on Thur has now set up a possible successful retest of the Jan lows and is consistent with the mid-2015 pattern shown below. We could still see 3750 as indicated by OntheMoneyUK, but from a contrarian perspective, the more bullish the markets look ST, the more bearish will be the LT result. The key is whether rates stabilize for the next few weeks with the TNX around 1.4-1.5%. If the mid-2015 analog is followed, a low is near with a slow and choppy path to new ATHs around 3980-90 in mid-late Apr, just in time for "sell in May". Several recent articles regarding the millennials (ages 25-40) plans to invest additional stimulus money may provide an upward bias.

The data mining alternative to the normal charts turned out to be more dificult than expected so todays Tech/Other only looks at the SPX 2x ETFs. Next week will look at the NDX 2x ETFs.
I. Sentiment Indicators
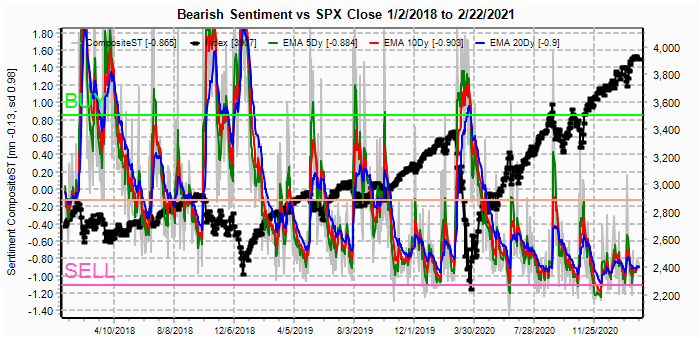
The overall Indicator Scoreboard (INT term, outlook two to four months) bearish sentiment rose slightly last week, but not enough to support a sustained rally.

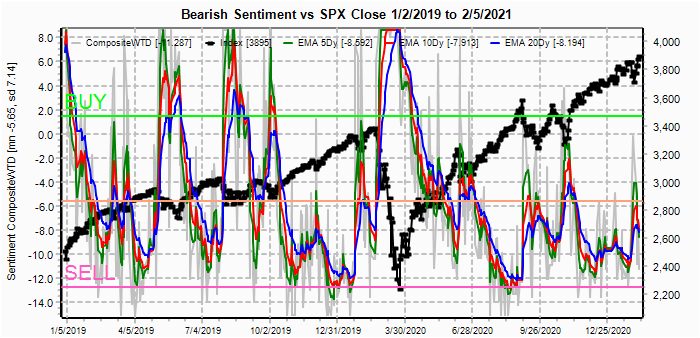
The INT view of the Short Term Indicator (VXX $ volume and Smart Beta P/C [ETF Puts/Equity Calls], outlook two to four months) bearish sentiment has rallied more strongly (due to VXX $ Vol below).

The VXX $ Vol rose sharply, exceeding slightly sentiment from the late Jan selloff. Combined with overall sentiment, this points to a more labored rally with less volatility to crush vol buyers.

Bonds (TNX). Bearish sentiment in bonds continues to lag behind prices. With the TLT (20 yr) now down 20% from the Mar 2020 highs, a combined 30-40% loss is probable by EOY.

For the INT outlook with LT still negative, the gold miners (HUI) bearish sentiment is close to unchanged and a move in HUI below 250 could easily fall another 20% to 200.

II. Dumb Money/Smart Money Indicators
The option-based Dumb Money/Smart Money Indicator as short/INT term (outlook 2 to 4 mns/weeks) bearish sentiment surprisingly FELL sharply as the dumb money jumped on the BTFD band wagon with both fists and is now approaching the late Dec 2020 levels.

And the sister options Hedge Ratio bearish sentiment also fell sharply after spiking during the Jan pullback. Less dynamic rallies are likely.

The INT term SPX Long Term (2x/DM) ETFs (outlook two to four weeks) bearish sentiment also surprisingly fell, showing INT investors share much the same complacency as ST options traders.

III. Options Open Interest
Using Thur closing OI, remember that further out time frames are more likely to change over time, and that closing prices are more likely to be effected. Delta hedging may occur as reinforcement, negative when put support is broken or positive when call resistance is exceeded. This week I will look out thru Mar 5. Fri is jobs report day, and large SPX OI will likely provide guidance for the week
With Fri close at SPX 3811, options OI for Mon show moderate put support at 3800 with minor support up to 3875 where call resistance starts. Moderate call resistance starts at 3925. Any early weakness is likely to be reversed.

Wed has smaller OI where SPX moderate put support moves up to 3850 with little net call resistance until 3925.

For Fri very large SPX OI is likely to drive weekly movements with strong put support up to 3850 and should be the minimum target for the week. Only minor call resistance exists between 3850 and 3950 so a larger rally can not be ruled out.

IV. Technical / Other
The following data mining chart shows the SPX 2x ETF components and the normal ratio. Sentiment fell to about -1.5 SD before the Jan pullback then rallied to a lower high late Jan. Surprisingly, the recent pullback saw lower bearish sentiment as longs (SSO) increased faster than shorts (SDS).

In order to examine the SDS & SSO options I set up an algorithm to see the outcomes of various combinations as shown below. As it turns out for an INT indicator, the ratio SDS/SSO (line 4) turns out to have the highest correlation (R). The next best is line 10, Dif A-B.

The data mining equivalent A-B is shown below and the more erratic movement in 2018 makes the simple ratio more preferable.

Conclusions. The rounded top I have been anticipating the last two months still seems to be in play with bonds and the PMs also following the expected script. Most of the bullish sentiment seems to be coming from the millennials who were born at the beginning of the greatest bull market of all time in bonds and have no idea what a secular bear market in bonds can be like (last time was the 70s). It is very likely that at sometime the Fed will have to chose between saving the bond market or the stock market, imagine the surprise if they chose bonds.
Weekly Trade Alert. ST weakness to start the week is not impossible, but SPX 3850+ is likely by Fri close with an upward bias to new ATHs thru mid-Apr. Updates @mrktsignals.
Investment Diary, Indicator Primer,
update 2020.02.07 Data Mining Indicators,
update 2019.04.27 Stock Buybacks,
update 2018.03.28 Dumb Money/Smart Money Indicators
Article Index 2019 by Topic, completed thru EOY 2020.02.04
Article Index 2018 by Topic
Article Index 2017 by Topic
Article Index 2016 by Topic
Long term forecasts
© 2021 SentimentSignals.blogspot.com