Last weeks SPX performance was as expected with ST sentiment showing Sells resulting in a continuation of the decline from Fri top of 4448 to about 4350 and low volatility. The close Fri was 4348 and surprisingly the VIX was also lower which hurt options traders (see Tech/Other). The performance of the VIX was so surprising that ZH had an article on it Fri. Next week is expected to see more downside before sentiment improves and with the EOQ JPM call wall at SPX 4320 a move to 4300 or lower is likely by Fri.
ST sentiment improved last week and may provide for a 1-2 day bounce, but weakness indicated in SPX options OI means that rallies are expected to fail thru EOM. Continued improvement in sentiment next week could lead to a strong bounce 1st half of July, but NDX sentiment at a weak Sell probably means disappointing EPS 2nd half of July and a stronger selloff.
This weeks Tech/Other section includes an update to the VIX call indicator to adjust for the VIX P/C as discussed last week and a look at how the volatility squeeze effected options pricing. A new section is also added this week with Tech/Other dropdown history lists by year and is located before the conclusion. The history lists currently go back thru late 2022 to include the 1960s data with "2022.12.10' the economic analysis debunking the "yield curve as a perfect recession indicator" for the last inflationary period of 1960-80 and "2022.12.24" the 1960s price analog using DJIA for 1966-70 compared to 2022-26.
I. Sentiment Indicators
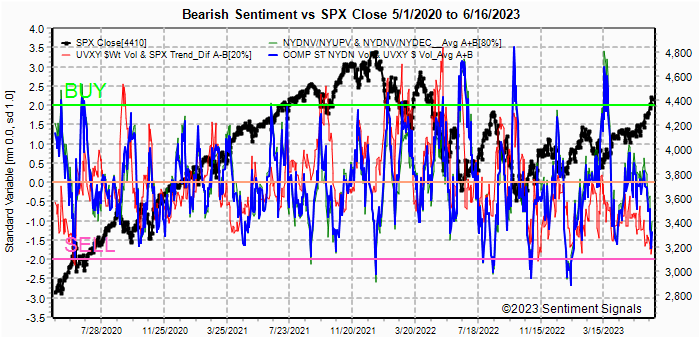
The INT/LT Composite indicator (outlook 3 to 6+ months) has three separate components. 1st is the SPX and ETF put-call indicators (40%), 2nd the SPX 2X ETF INT ratio (30%), and 3rd a volatility indicator (30%) which combines the options volatility spread of the ST SPX (VIX) to the ST VIX (VVIX) with the UVXY $ volume. This week breaks SPX options into volume adj (1/B-A) and traditional spread (A-B).
Update Alt. In this case the wts for the SPX 2X ETF ratio (SDS/SSO) and SPX puts & calls spread are adj to equal as in the DM/SM section for SPX ETFs. Bearish sentiment was little changed and remains on a weak Sell.


Update. Bearish sentiment moved up sharply and may support a 1-2 day rally, but the ST direction remains down.

Update EMA. Bearish sentiment VST (grn) reached a weak Buy so a bounce is likely, but LT (blu) is neutral so a directional change is unlikely.

Update EMA. Bearish sentiment increased somewhat, but remains negative.


Update. Bearish sentiment for the ETFs remain near a weak Buy, but overall sentiment is neutral as prices continue to erode. Gold seems to be following the SSEC downward.

II. Dumb Money/Smart Money Indicators
This is a new hybrid option/ETF Dumb Money/Smart Money Indicator as a INT/LT term (outlook 2-6 mns) bearish sentiment indicator. The use of ETFs increases the duration (term).
Update. Bearish sentiment was little changed.


For the SPX, I am switching to hybrid 2X ETFs plus SPX options. Taking a look at the INT term composite (outlook 2 to 4 mns), bearish sentiment was little changed.

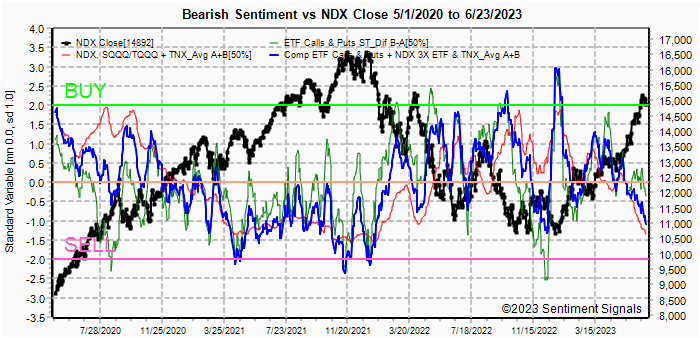
Bearish sentiment declined slightly, now at the weak Sell. July EPS season may be a disappointment as layoffs are likely to provide less support than 2023Q1.
III. Options Open Interest
Using Thur closing OI, remember that further out time frames are more likely to change over time, and that closing prices are more likely to be effected. Delta hedging may occur as reinforcement, negative when put support is broken or positive when call resistance is exceeded. This week I will look out thru June 30. A text overlay is used for extreme OI to improve readability, P/C is not changed. Also, this week includes a look at the GDX & TLT for Sept exp. A new addition is added for OI $ amounts with breakeven pts (BE) where call & put $ amounts cross.
With Fri close at SPX 4348, options OI for Mon is moderate with strong put support at 4300. Calls from 4300-20 will attract prices as will puts at 4325 and 4350, midrange 4300-50 likely.


Using the GDX as a gold miner proxy closing at 29.8 likely range is 28-31. Sept shows strong put support at 30, so longer downside should be limited.

Currently the TLT is 103.3 with the TNX at 3.74%, strong support/resistance is 95/110 and moderate support at 100. Possible range 101-108 or TNX approx 3.4-3.8%.

IV. Technical / Other
This week I updated the VIX call indicator adding the VIX P/C adjustment mentioned last week. The first chart is the original.

The second chart does not show any major changes except a much stronger Buy in Nov 2020 (good for SPX +50%) and weaker Sells for the last two signals.

I ran out of time to discuss the importance of the projected decline in volatility last week, but those of you probably noticed as it was extremely hard to make money with puts and leveraged ETFs. With the VIX at 14.5 the previous Fri AM at SPX 4448, the VIX dropped to about 13 when the SPX was near 4340. Most options investors are aware of price sensitivity (delta) and time to expiration (theta), but an overlooked sensitivity is to volatility (vega). The result shown in the next chart is that even with a 100+ pt drop in SPX puts can still lose money.

This shows the intraday price for the SPX June 30 4300 put. At Tue open of SPX 4300 it was $8, but by mid-Fri afternoon with the SPX down 50+ pts the price was near $5. especially notable was the sharp drop Thur with the SPX near 4370 and the VIX dropped almost a pt.

The following uses barcharts.com as a source and discusses S&P futures (ES) as a third venue of stock sentiment in addition to options and ETFs. The non-commercial/commercial spread represents a LT bearish sentiment (dumb money/smart money) indicator. As explained in investopedia, commercial investors (red) are institutions and are smart money, while non-commercials (green) are speculators such as hedge funds and are dumb money. Here is the current barchart graph for the S&P 500 (top) and trader positions (1st bot) with positives as net longs and negatives as net shorts. Bearish sentiment is represented by the spread and is positive if red > green (Buy) and negative if green > red (Sell). Sentiment is a strong BUY.
Tech / Other History
Click dropdown list to select from the following options:
2023
2022
Conclusions. Hidden in the despair of the UK & EU rate hikes
and recessionary PMI's for Europe, the US service sector PMI's showed
continued growth and with the unexpected pickup in homebuilding, US 2nd Qtr GPD
is estimated at 2%, well off a recession level. The US remains
well-cushioned from the fuel and food inflationary effects of the Russia-Ukraine
war and the biggest threat is wage inflation latter in 2023 as strikes become more common and the current surge in credit-based spending comes to a
halt.
Weekly Trade Alert. A pickup in volatility is expected next week
although the downside risk is not much below SPX 4300. Updates @mrktsignals.
Investment Diary,
Indicator Primer,
Tech/Other Refs,
update 2021.07.xx
Data Mining Indicators - Update, Summer 2021,
update 2020.02.07 Data Mining Indicators,
update 2019.04.27 Stock Buybacks,
update 2018.03.28 Dumb Money/Smart Money Indicators
Article Index 2019 by Topic, completed thru EOY 2020.02.04
Article Index 2018 by Topic
Article Index 2017 by Topic
Article Index 2016 by Topic
Long term forecasts
© 2023 SentimentSignals.blogspot.com