
Last week was a hit and a miss. An overall increase in volatility, but a positive bias was a hit with an opening gap up followed by an almost 2% drop before an almost 4% rally. The easy passage of the debt ceiling bill was a miss, however, with a surprising drop in int rates (less default risk). Even with the strong growth in jobs seen in Fri, the TNX remains below 4% (3.8%) and therefore supportive of higher SPX prices. Much of the rally Fri in the DJIA (+2%) came from BKX (+4%) which was a total surprise.
With essentially two down days and two up days to end the week, sentiment remains relatively unchanged from last week. Bigger picture, prices for both SPX and NDX have exceeded my expectations, but there is little evidence of an INT top. One of the things I like to see at a turning point is a high/low at a quarterly optn exp on high volume (last Mar low) and its possible we see that June 16. One EW analyst that sees a top in June at SPX 4330-70 still thinks a drop to SPX 3000 or lower is possible this year, but I don't see it sentiment wise.
Tech/Other this week looks at a ST/INT indicator with strong performance since mid-2020, while next week I want to take a drill down into some P/C ratios that show a INT top is approaching, but likely to be more like 2018's 15-20% drop variety rather than the 30%+ that most are looking for.
I. Sentiment Indicators
The INT/LT Composite indicator (outlook 3 to 6+ months) has three separate components. 1st is the SPX and ETF put-call indicators (40%), 2nd the SPX 2X ETF INT ratio (30%), and 3rd a volatility indicator (30%) which combines the options volatility spread of the ST SPX (VIX) to the ST VIX (VVIX) with the UVXY $ volume. This week breaks SPX options into volume adj (1/B-A) and traditional spread (A-B).
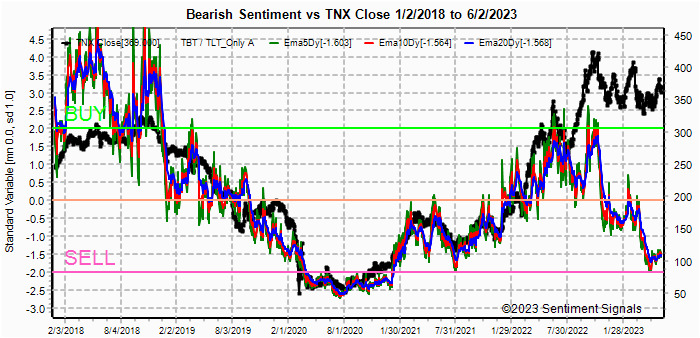
Update Alt. In this case the wts for the SPX 2X ETF ratio (SDS/SSO) and SPX puts & calls spread are adj to equal as in the DM/SM section for SPX ETFs. Bearish sentiment improved slightly with many refusing to believe in the rally.


Update. Bearish sentiment remains near neutral.

Update EMA. Bearish sentiment VST (grn) pulled back to neutral.

Update EMA. Bearish sentiment declined with the VST dropping back to the weak Sell level.


Update. Bearish sentiment rose sharply for the ETFs with prices rising slightly.

II. Dumb Money/Smart Money Indicators
This is a new hybrid option/ETF Dumb Money/Smart Money Indicator as a INT/LT term (outlook 2-6 mns) bearish sentiment indicator. The use of ETFs increases the duration (term).
Update. Bearish sentiment was down slightly.


For the SPX, I am switching to hybrid 2X ETFs plus SPX options. Taking a look at the
INT term composite (outlook 2 to 4 mns), bearish sentiment reversed upwards
slightly.

Bearish sentiment declined slightly.

III. Options Open Interest
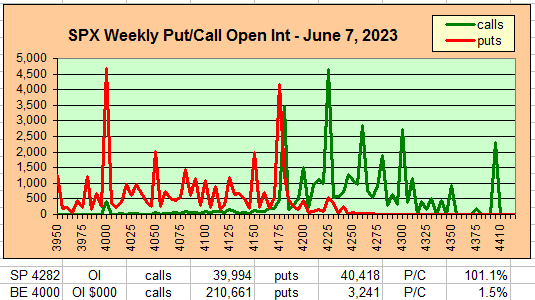
Using Thur closing OI, remember that further out time frames are more likely to change over time, and that closing prices are more likely to be effected. Delta hedging may occur as reinforcement, negative when put support is broken or positive when call resistance is exceeded. This week I will look out thru June 9. A text overlay is used for extreme OI to improve readability, P/C is not changed. A new addition is added for OI $ amounts with breakeven pts (BE) where call & put $ amounts cross.
With Fri close at SPX 4282, options OI for Mon is small and delta hedging may keep prices between 4250-300.


IV. Technical / Other
Looking over some of the techinal indicators I track, I was surprised to find a strong correlation (80%) using the NYMO vs SPX trend (10 day ma). As a ST/INT indicator 6 of the 7 Sells since early 2022 resulted in a mult-week decline, the exception was in Apr where there was only a consolidation. Currently, the indicator has just turned negative, but is well away from a Sell.

The SPX ST, 1-hrly, .
The following uses barcharts.com as a source and discusses S&P futures (ES) as a third venue of stock sentiment in addition to options and ETFs. The non-commercial/commercial spread represents a LT bearish sentiment (dumb money/smart money) indicator. As explained in investopedia, commercial investors (red) are institutions and are smart money, while non-commercials (green) are speculators such as hedge funds and are dumb money. Here is the Tues barchart graph for the S&P 500 (top) and trader positions (1st bot) with positives as net longs and negatives as net shorts. Bearish sentiment is represented by the spread and is positive if red > green (Buy) and negative if green > red (Sell). Sentiment is a strong BUY.
Conclusions. Late Dec and Jan most were looking "for the other shoe to drop"
taking the SPX to 3000 or lower by mid-2023, with many referencing the "perfect recession
indicator", the inverted yield curve. Looking back to the last major inflation cycle
that began shortly after the Vietnam war started in 1965, my outlook following a similar period
of near zero int rates was for a continued period of growth with low unemployment and higher
stock prices to possibly retest the ATHs before inflation. Early 2023, extreme
hedging in the NDX was a indication that techs would lead the rally, but the spread of AI
technology may have accelerated that rally, and sentiment indicates that a majority still
doubt the staying power of both the stock market and the economy, probably due to continued
weakness in manufacturing. L. Roberts
recently published an article that explains how the US economy is consumer-based (80%) and a
strong consumer base has prevented an overall economic contraction several times in the past
when manufacturing is weak.
Weekly Trade Alert. There may be a pullback to SPX 4100 (edit 4200, thanks red) next week. The
following week has CPI, PPI, and FOMC where 4300+ is possible if the Fed decides to pause.
Updates @mrktsignals.
Investment Diary,
Indicator Primer,
Tech/Other Refs,
update 2021.07.xx
Data Mining Indicators - Update, Summer 2021,
update 2020.02.07 Data Mining Indicators,
update 2019.04.27 Stock Buybacks,
update 2018.03.28 Dumb Money/Smart Money Indicators
Article Index 2019 by Topic, completed thru EOY 2020.02.04
Article Index 2018 by Topic
Article Index 2017 by Topic
Article Index 2016 by Topic
Long term forecasts
© 2023 SentimentSignals.blogspot.com
The strong rally up fooled me Arthur as I was really expecting to see it happen later on, not at the end of May and early June. And I got fooled on them passing the debt ceiling this fast. I was expecting it to drag out much longer as I didn't think the Republicans would cave in and give the Democrats an open checkbook with zero limit until 2025.
ReplyDeleteIt is what it is I guess, so we have to move on and trade the hand given to us. Seasonality was quite bullish from the last few days of May until the first few days of June, so I guess I should have expected a move up, but I didn't think it would be that powerful.
Currently the Seasonality is weak into the next week and then choppy to bullish into OPEX, and quite bearish the rest of the month (that period is equal in the strength we just saw for the up move last week).
Considering now that the debt ceiling has be approved the government is going to start selling Treasuries to raise money. Their auction starts on Monday with $65 Billion in 13 week bills and 58 Billion is 26 week bills, but over the entire month of June it will be around a Trillion Dollars. I can't see how this will be bullish for stock market as money will have to come from somewhere to buy these notes.
However, due to this issue I do think the Fed will pause this coming meeting but won't officially say it's a pause... meaning they will raise again at the next meeting. That could give the market a pop after this Wednesday, which aligns with Seasonality being choppy to slightly bullish into OPEX. But it might not take out the high from last week... not sure?
It would depend I guess on how deep of a pullback we get into the meeting, which I'm not sure if you meant to say "Weekly Trade Alert. There may be a pullback to SPX 4100 next week", or if that was a typo and you mean 4200 or so? If you meant 4100, and that's reached, then I don't see a higher high into OPEX but a double top instead... meaning of course a few points over or under last weeks high, but no big breakout over 4350.
If this happens then with the Seasonality quite weak into the end of June that could be where we see a bigger pullback before another strong (very, very strong) rally up into late July where I could see a final high before a much bigger correction. How big I don't know but one that takes out 4000 at least, if not much more?
In conclusion my thoughts are down in front of the FOMC next week and a choppy upward move into OPEX before a bigger pullback into the end of June with the final rally up into late July followed by your 15-20% move down (or more... don't know?).
Not sure why it didn't login me in but that comment was me. Thanks for continued updates Arthur.
ReplyDeleteI just realized the FOMC isn't next week but the week after (duh... I'm getting old and forgetful)... so since it's around OPEX it could be a turning point for sure. I still think we pullback next week though and do a choppy move up into the meeting.
ReplyDelete