
Last week was not a good week to be a contrarian as strong bullish sentiment in the SPX 4300-400 area did little to hinder the "buy the rumor" aspect of the prospect of a Fed "pause" at the FOMC Wed. At least I continued to bat near 1000 on my economic outlook, correctly calling for a "hawkish" pause with more hikes expected later in the year. Thur init jobless claims showed more weakness, which seemed to reignite the more dovish Fed outlook and reverse the "sell the news" trend, taking the SPX to the 4450 area mentioned as an EW target last week. Taking a step back to look at the big picture, the first SPX rally off the Oct 2022 lows was also 600+ pts (A/1), while the consolidation wave (B/2) retraced about 400 pts, and so far the last rally leg (C/3) is 640 pts. So the move over SPX 4400 should not have been a surprise, but wilth B/2 looking like a bear flag or H&S, its easy to see why many were surprised. My biggest surprise was the near 78% retracement of the NDX since Jan. If the pattern continues, we could see a 400 pt pullback to the same SPX 4050-100 by Sept-Oct before a final move to about 4700 by mid-2024 which would match the 1967-69 analog nicely.

This weeks Tech/Other section takes an in-depth look at the various put/call ratios and the possible effects of the strong increase in same day (0DTE) options trading.
I. Sentiment Indicators
The INT/LT Composite indicator (outlook 3 to 6+ months) has three separate components. 1st is the SPX and ETF put-call indicators (40%), 2nd the SPX 2X ETF INT ratio (30%), and 3rd a volatility indicator (30%) which combines the options volatility spread of the ST SPX (VIX) to the ST VIX (VVIX) with the UVXY $ volume. This week breaks SPX options into volume adj (1/B-A) and traditional spread (A-B).
Update Alt. In this case the wts for the SPX 2X ETF ratio (SDS/SSO) and SPX puts & calls spread are adj to equal as in the DM/SM section for SPX ETFs. Bearish sentiment took a sharp downturn last week indicating a multi-week pullback is likely soon.


Update. Bearish sentiment fell sharply, but remains short of an official Sell. This may indicate a weaker decline or more topping behavior.
Update EMA. Bearish sentiment remains below the weak Sell level.


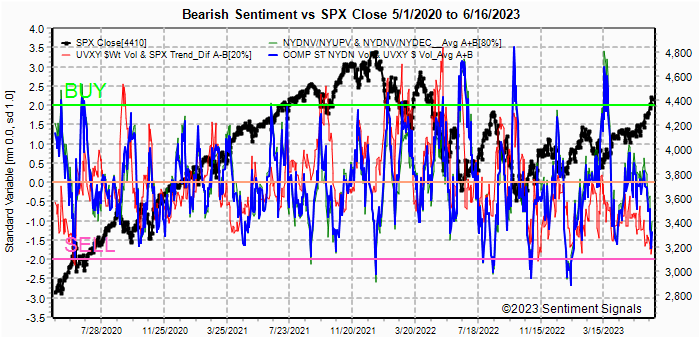
Update EMA. Bearish sentiment declined close to a Sell that likely means the "easy" part of the rally is over, but as in late 2020 and 2021, continued advances are possible.


Update. Bearish sentiment remains near neutral overall, while the weak Buy from ETF sentiment seems to have little effect.

II. Dumb Money/Smart Money Indicators
This is a new hybrid option/ETF Dumb Money/Smart Money Indicator as a INT/LT term (outlook 2-6 mns) bearish sentiment indicator. The use of ETFs increases the duration (term).
Update. Bearish sentiment spiked downward, nearing the levels seen in early 2021.


For the SPX, I am switching to hybrid 2X ETFs plus SPX options. Taking a look at the INT term composite (outlook 2 to 4 mns), bearish sentiment remains near the neutral level near the ETF sentiment as options volume and put-call spread offset.

Bearish sentiment fell sharply for the week as the NDX continued to soar over 15k, and now matches the sentiment level of the Mar 2022 high near 15.3k.

III. Options Open Interest
Using Thur closing OI, remember that further out time frames are more likely to change over time, and that closing prices are more likely to be effected. Delta hedging may occur as reinforcement, negative when put support is broken or positive when call resistance is exceeded. This week I will look out thru June 23. A text overlay is used for extreme OI to improve readability, P/C is not changed. Also, this week includes a look at the GDX for Dec exp. A new addition is added for OI $ amounts with breakeven pts (BE) where call & put $ amounts cross.
With Fri close at SPX 4410 and BE at 4175, options OI for Tue is moderate with strong call resistance at 4400. Likely range SPX 4375-4400.


For Fri EOM strong call resistance at 4370 and at the JPM call position of 4320, indicate a drop toward 4320 is likely. Core inflation PCE is released early AM and continued high numbers may be catalyst for a decline.

IV. Technical / Other
Part of the reason for reviewing the Put / Call ratios and components is the recent coverage of the growth in same day options (ODTE). The chart below shows the growth in 0DTE compared to other maturities growing from a few % in 2014 to over 40% of volume the last two years with the introduction of weekly then daily M/W/F to everyday for many (SPX & ETF) products.

The following shows the call volume (Equity, ETF, SPX) since 2018. Just over the last two years, the result of 0DTE appears to have increased the volume of ETF options by 33% from 600k to 800k, while SPX options have doubled from 400k to 800K. This may have had a negative effect in Equity volume. As far as sentiment, there does seem to be a ST spike in call buying at ST and INT tops which we do see today, but the relative strength is hard to ascertain due to 0DTE growth.

Looking at the Equity P/C since 2018, the current P/C is at the same level as other multi-week tops since mid-2022, but not a major top.

Looking at the ETF P/C since 2018, spikes below 1.0 are usually seen before ST & INT tops, but the consolidation arouund 1.2 is unusual and may indicate a low volatility period similar to much of 2021.

Looking at the SPX P/C since 2018, there is definitely signs of higher volume that has been seen at INT tops, but the extreme low P/C is not. This seems to be an artifact of 0DTE trading of puts & calls (strangles, etc) to make volatility plays and so the most likely outcome would be a reduction in volatility. So, INT/LT bullish/neutral.


The following uses barcharts.com as a source and discusses S&P futures (ES) as a third venue of stock sentiment in addition to options and ETFs. The non-commercial/commercial spread represents a LT bearish sentiment (dumb money/smart money) indicator. As explained in investopedia, commercial investors (red) are institutions and are smart money, while non-commercials (green) are speculators such as hedge funds and are dumb money. Here is the current barchart graph for the S&P 500 (top) and trader positions (1st bot) with positives as net longs and negatives as net shorts. Bearish sentiment is represented by the spread and is positive if red > green (Buy) and negative if green > red (Sell). Sentiment is slightly weaker, but remains a strong BUY.
Conclusions. The drop to SPX 3800 by Sept-Oct is starting to look
less and less likely, however, the drop to 4050-4100 remains consistent with the
SPX current rally pattern since Oct 2022 as the 4th wave of an impluse higher.
Its possible that a move into a major high in 2024 creates a divergence with a
new ATH in NDX, but not in SPX or DJIA. I'm no expert in TA, but I believe
that leaves open the possiblity for higher highs even if the next bear leg drops
down to the low SPX 3000's in 2025-26. The main takeaway from the put/call
analysis is that if there is a 4th wave down to SPX 4100 or lower, it will
likely be less volatile than the Dec-Mar period.
Weekly Trade Alert. Limited downside is expected next week from SPX
4350-4400+. The following week may be more volatile with core PCE on Fri. Updates @mrktsignals.
Investment Diary,
Indicator Primer,
Tech/Other Refs,
update 2021.07.xx
Data Mining Indicators - Update, Summer 2021,
update 2020.02.07 Data Mining Indicators,
update 2019.04.27 Stock Buybacks,
update 2018.03.28 Dumb Money/Smart Money Indicators
Article Index 2019 by Topic, completed thru EOY 2020.02.04
Article Index 2018 by Topic
Article Index 2017 by Topic
Article Index 2016 by Topic
Long term forecasts
© 2023 SentimentSignals.blogspot.com
No comments:
Post a Comment