Saturday, July 29, 2017

The Dollar is the Key

Many of the recent trends in the markets do not seem to make sense except in consideration of the effects of the US dollar which rallied about 10% the last few months of 2016 based on increased growth expectations of the Trump agenda, but began to falter with Trump's support in Q1 and has been in a waterfall decline since.  The DJIA, which is made of of multinationals with much of their sales overseas, has particularly benefited as products priced in dollars are now discounted.  A strong example is Boeing whose planes sell for $50 million or more and whose stock is up over 40% this year.  Unfortunately after dropping from 104 down to 93 in a little over six months and two points in July, the US dollar may bottom soon around 90 and rebound.  So tailwinds for the DJIA, oil and gold may soon become headwinds.

I. Sentiment Indicators

The overall Indicator Scoreboard rebounded slightly with Thursday's mini flash crash, but remains in the near SELL area.


The Short Term Indicator (VXX $ volume and Smart Beta P/C) dropped to the SELL level Tues as posted on Twitter, but I rated this as a warning only since most of the decline was due to very low VXX $ volume as shown below.


Based on what appears to be a washout of VXX volume, the lows are probably in for the VIX (8.84) and VXX volume.


However, the Smart Beta P/C still looks like it should go lower for a top.


The NDX/QQQ ETFs nearly reached my target at NDX 6000 (5995) with sentiment falling to recent lows before the last two day selloff that has given only a weak BUY.  It is hard to tell if the highs are now in.


Bearish sentiment for bonds (TNX) moved toward neutral with the sideways movement likely to continue.


Gold stocks (HUI) are pushing up against the upper bounds of the recent trading range at the 200 SMA and it is surprising that given the weakness of the US $ that gold stocks have not been stronger.


II. Options Open Interest

This week I am going to look at the weekly setup through to the Aug 18 expiration.  For Aug 4, normally prices should drop below the SPY 246 level, but since 246 was successfully tested with a rebound to 247 to close the week, the more likely outcome seems to be a tight range around 247 unless 248 is exceeded.


For Aug 11, this week shows a possible range of SPY 246 to 248 with strong resistance over 248.


For Aug 18, huge levels of put support have built up over the past couple of weeks in the 243 to 247 area that seem to indicate the best chance for a push to 248 or higher as long as the 243 support level holds.


Looking ahead to Sept 15, the put levels at 240 have doubled while calls have remained constant, reducing the chance for a decline below 240.


Conclusions.  A top is approaching but it hard to tell when.  Last weeks minor pullback increased bearishness that may elevate markets for another two or three weeks.  Another factor is the US $ which seems to be supporting the DJIA even as other sectors struggle.  An analyst at B of A discusses his outlook of the US $ influence at ZH last week.

Weekly Trade Alert.  None.  More consolidation short term seems likely.   Updates @mrktsignals.

Article Index 2017 by Topic
Article Index 2016 by Topic

© 2017 SentimentSignals.blogspot.com

Saturday, July 22, 2017

Heisenburg's Uncertainty

A market top may finally be approaching, but what kind of top and when.  Today, I will show a graphical version of the VIX call volume indicator that I have been discussing for several weeks that indicates a top in 2 to 3 weeks, but the continued persistence of the NDX/QQQ high bearish sentiment shows that higher prices are still likely in the intermediate term.

I. Sentiment Indicators

The overall Indicator Scoreboard has now dropped to the SELL level but does have a tendency to lead any pullback by one or two weeks,


The Short Term Indicator (VXX $ volume and Smart Beta P/C) continues to show measurable hedging somewhat similar to the 2015 periods of Apr-May and July-Nov, so this may be "smart money" hedging.


Another possibility is that the Smart Beta P/C is effected by QQQ puts.  Shown below is the SQQQ/TQQQ $ ratio which shows that the NDX is still heavily shorted even though ATHs have been made.  I would not be surprised by a continued push over 6000.  Comparing this to the SPX chart shown above for the 2015 declines, a move down to the neutral level is likely before further meaningful declines.


Another sentiment indicator that shows bearish potential is the Level of VIX calls. I've been watching VIX P/C and particularly VIX call buying as a "smart money" short indicator at market tops for some time, while "dumb money" piles in at bottoms, and finally figured out how to quantify it (via graph).

To setup a chart, I compared the SPX as a % (green) over/under the 20 day SMA (zero line), and for the VIX calls, the 10 day SMA (red) is divided by the daily avg since 2014 (zero line) so that 0.5 equals 50% above avg.  On the chart, "smart money" Sell levels are the VIX SMA of 50% above avg and occurred 1 to 3 weeks prior to Mar and May tops.  For the "dumb money" Buys occurred at the late March and mid-May bottoms with no delay also at the VIX SMA of 50% above avg.  April was unusual because the Buy produced a two week sharp rally that increased the VIX call SMA to 1.0 with a Sell adding .5 to the starting level.  As of Friday the VIX call SMA reached .5, so a top is expected in 1 to 3 weeks.


Bearish sentiment for bonds (TNX) dropped sharply as rates fell, indicating that a trading range is likely.


Sentiment for the gold stocks (HUI) seemed to be correct last week as prices moved up about 2% due to weakness in the USD helping gold prices, but were also accompanied by a sharp rise in bearishness as the 200 day SMA is overhead resistance.  This one is just too hard to call.


II. Options Open Interest

Since we just had the July monthly expiration I want to do a 3 month look a head for the SPY and VIX.  To tell you the truth the SPY open int is so low for the next two weeks that it is hard to make much sense of it, so I am going to take the bigger picture view of combining the next two weeks with the Aug monthlies.  There is very strong call resistance at 245 and above, but since we closed at 247, a move to 248 or higher is possible short term.  Put support is high at 244/5 but drops off sharply below that down to 240.  Most likely is 244/5, but there is a lot more risk than reward.


For Sept 15, I have expanded the range and there is little put support above 240, with major support at 230, for call resistance 245 is minor while 250 is huge.  This looks like a recipe for wild price swings.


For Oct 20, there is fairly strong put support all the way up to 242 with little call resistance until 249. If there is a strong decline into mid Sept down to 235 or lower, Oct looks like it should rally back to near ATH levels fairly quickly.


Moving on the the VIX for Aug 16, a modest increase in the 12-14 range seems likely with large call resistance above.


For Sept 20, put support is likely to push the VIX up to the 14/5 range and possibly above 18.


For Oct 18, huge call resistance is likely to push the VIX down to 14 or lower.


Conclusions.  Last week the SPY pushed up to the 147 resistance level and stopped.  Both the overall Indicator Scoreboard and VIX call levels indicate that a pullback is likely to start in the next two or three weeks.  SPY and VIX options open int indicate that a drop to SPX 2350 or lower is likely by mid Sept, but a very sharp rebound is likely to the upper SPX 2400s by mid Oct.  NDX sentiment indicates that there may be more short term upside to 6000 or higher.

Weekly Trade Alert.  None.  One characteristic of a bubble is to cause panic buying by bypassing normal pullbacks.  Opportunity for a good short is ahead.   Updates @mrktsignals.

Article Index 2017 by Topic
Article Index 2016 by Topic

© 2017 SentimentSignals.blogspot.com

Saturday, July 15, 2017

Delayed Fireworks

Last week provided the excitement promised by the SPY options interest with the NDZ/QQQ reaching my target for mid August.  ZH earlier this week reported that a supercomputer researching global stock markets in Zurich has identified a Sornette bubble in US stocks.

I. Sentiment Indicators

The overall Indicator Scoreboard showed a fairly large drop in bearish sentiment levels this week, but no SELL yet.  For this week I am again showing the last 18 months with INT EMAs.


But the Short Term Indicator (VXX $ volume and Smart Beta P/C) showed only a muted response.


The NDX has show a very persistent high level of bearishness, even with a new recovery closing high, indicating that a continued rally to new highs is likely.


Bearish sentiment for bonds (TNX) moved back to neutral as rates consolidated between 2.3 and 2.4%.


The gold stocks (HUI) showed a decrease in bullishness as the compression or "coil" seems to continue.  Many times this type of pattern will begin with one or more false moves as the GDX options seem to indicate a fall to 20 (-10%) before a rally to 24.


The BKX chart last week indicating a SELL ST proved accurate as Friday's EPS were disappointing with a 2% opening drop, but recovered with the overall market.

II. Options Open Interest

This week I want to look at the SPY, QQQ and VIX out to August.

For the SPY, last weeks "the bulls were free to roam" was prescient with a close at 245.5, but is unlikely to be repeated this week.  A move down to 242 to fill the SPX gap at 2426 looks likely, with a close at 243.5 most likely.


For the last week of the month, the outlook is somewhat confusing where 242-3 is the "max pain" zone, but call resistance is light if the bulls decide to run.


The August monthly shows strong put support at 235, 240 and 244-5, with strong call resistance at 244-5. The overlap from 244-5 will probably be a strong area of contention with the potential of whipsaws from one side to another.  A low at 241-3 is most likely.  Given the VIX forecast range of 12-14 as a higher range than we've seen recently, possible wild swings seem likely.


For the VIX in August, a range of 12-14 seems likely, with a short term move to 18 possible if 15 is exceeded.


For the QQQ, next week looks tough for a continued move higher from the close at 142.2, while a whipsaw back to the gap at 139 is possible.


For August, call resistance is somewhat lower, but if the SPY overcomes the put/call overlap peak at 245 similar to how the QQQ did this week, a move to 145 or higher seems likely.


Conclusions.  A surprise to the upside brings us back to the 2014 scenario, but the path from here is unclear.  NDX sentiment clearly supports higher prices, while other sentiment is not overly bullish.  One scenario that seems to make sense is a ST pullback to fill gaps next week at SPX 2426, QQQ 139 then a move up into late July/early Aug.  Another strong jobs number may bring into question the "low rates forever" mantra, but would probably be first welcomed.  The last two months divergence between ADP and NFP were very unusual.

Weekly Trade Alert.  Tues AM was so boring I took a 20 min break and missed the mini "flash crash" which filled the DJIA gap and almost the SPX one.   Next week a pullback to SPX 2426, QQQ 139 may provide a second opportunity.  Updates @mrktsignals.

Article Index 2017 by Topic
Article Index 2016 by Topic

© 2017 SentimentSignals.blogspot.com

Saturday, July 8, 2017

Bumpy Road Ahead

Sentiment did not get much of a boost last week with the continued volatility which has me concerned that we may be entering a trading range between SPX 2400-50 for several weeks in a rounding top pattern similar to mid-2015.  Options open interest continues to show moderate strength for the markets thru mid-Aug.

I. Sentiment Indicators

The overall Indicator Scoreboard showed only slight increase in bearish sentiment.  For this week I am again showing the last 18 months with INT EMAs.


Similar action for the Short Term Indicator (VXX $ volume and Smart Beta P/C).


Bearish sentiment for bonds (TNX) fell considerably, however, as the stock volatility increased the demand for a safe haven, almost to the point of giving another SELL.


The gold bugs (HUI) must be smoking too much medical marijuana, showing the most bullishness since the Feb highs as the HUI dropped back to the 180 area that has been support for several months.  More in options OI section.


On May 20, I showed a 2017 sentiment chart for the BKX, indicating a ST BUY.  Since that time the BKX has rallied 10%, powering the DJIA to new ATH, but this week shows a stronger SELL.  With big money center banks reporting EPS on Friday, we may start to see weakness in that sector and the DJIA soon.


II. Options Open Interest

This week I want to look at two weeks forward for the SPY and three months forward for the QQQ and GDX.

The SPY for July 14 shows strong support at 242 and below with a small dip at 241 there is little resistance above, so the bulls are free to roam once over 242.


But the July 21 resistance at 247 and to a lesser extent at 245 will likely provide a difficult wall to overcome.


Many EW analysts have declared confirmed downtrends for the major averages based on the recent action of the tech stocks.  Last week I showed that the sentiment measure SQQQ/TQQQ was showing very strong bearish sentiment that could lead to a significant rally, and this week I want to look at the QQQ July-Sept options OI for confirmation.  First for July 21 (posted Wed am on Twitter), strong support between 134-136 means that this level is unlikely to be penetrated for a long period of time, and Thur saw a drop to 135.8 followed to a rally Fri to 138.  A likely pin or close for the 21st is 139-140 with strong resistance at 140.


For Aug 18, support moves up to 138 with a possible push higher to 141-2.


For Sept 15, we see somewhat of a similar pattern to the SPY two weeks ago, with support at 135 and even stronger support at 130, but little support in between.  The lack of call resistance is somewhat odd, but would allow for higher prices as shown by the SPY.  Conclusion, new lows ahead.


Moving on the the GDX, since the first target of 21 was reached last week, it seemed appropriate to do a followup.  July 21 OI shows huge resistance at 22 and 23 with moderate support at 20-22.  The likely range seems to be 20.5 to 21.5.


For Aug 18, resistance from calls is likely to overpower support, pushing prices to 20 or lower.


For Sept 15, a strong reversal is still showing as likely with an upside target in the 23-24 range.  This matches well with the potential for an event driven stock pullback, but shows a lower upside that before.


III. Technical Indicators

The only item I want to mention here are the SPX gaps from a couple of days ago at 2432 and Friday's 2410 that may need to be filled.

Conclusions.  The SPX was up a total of two points last week that pretty much matched my outlook but somewhat lower highs and lows than expected.  Next week looks like a "do or die" week for the SPX as options OI point to potential for a move into the 2440s, but sentiment is showing only weak support.  Ideally, I would like to see an early pullback to fill the gap at SPX 2410 then a quick move to 2432, but only time will tell.

Weekly Trade Alert.  No trades were executed last week as I was holding out for a gap fill on the DJIA just below 21300 to go long.  This week an early pullback to SPX 2410 may provide another opportunity.  Long SPX 2410, Stop 2400, target 2440+.  Updates @mrktsignals.

Article Index 2017 by Topic
Article Index 2016 by Topic

© 2017 SentimentSignals.blogspot.com

Saturday, July 1, 2017

Smart Money is Proactive, Dumb Money Reactive

We all want to be smart money and lead the pack, but human psychology tells us to be dumb money and follow the herd.  So today I want to focus on how to tell what the smart money is doing at tops, specifically by looking at VIX puts and calls.  The usage of VIX options will be covered in the options open interest section, while the technical indicator section will take a look at the use of price gaps.

I. Sentiment Indicators

Sentiment overall has seen an increased level of bearishness that is approaching the levels of the sharp May 17-18 decline, also of 50 SPX pts.  The question one needs to ask is whether this is the beginning of a larger decline, in which case bearishness can increase much more, or whether this is just more of the same, indicating the possibility of a 50-75 SPX pt rally.  My overall conclusion is the later.

The overall Indicator Scoreboard early in the weak fell to the SELL level on Monday for the third time in two months and has shown only a weak bounce, so it is unclear if sentiment is strong enough to power to a new high.  For this week I am showing the last 18 months with INT EMAs.


However, since I have been comparing 2017 to 2014 I wanted to compare sentiment as well.  Notice that time periods are off by two months since I wanted to show 2014 thru August, but both periods saw low bearishness hitting -14 in Dec of the previous year then followed by BUYs in Apr and three SELLs in the May-June periods.  In 2014, however, prices continued to rise as did the level of bearishness until a BUY was signaled with the sharp August selloff.


The Short Term Indicator (VXX $ volume and Smart Beta P/C) also shows only weak support for a rally, but continued volatility next week is likely to push levels higher.


Sentiment for bonds (TNX) moved back to neutral after the recent strong move up in rates so its difficult to gauge a direction at this point.


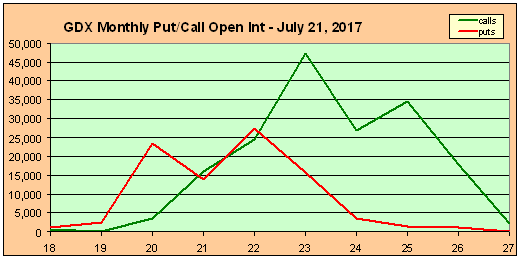
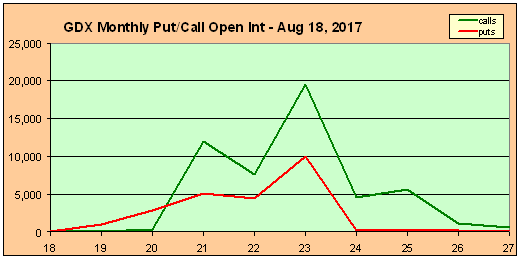
Sentiment for gold stocks (HUI) fell even as prices declined, probably due to safe haven demand with the volatility in the stock market.  Lower prices seem likely.


Finally, just to take a look at a couple of the leveraged ETF ration for SPX and NDX that do show the highest level of bearishness for this year.  The SPXU/UPRO $ ratio has risen to the level equal in May 2016 which was followed by an 80 pt SPX rally as well as June 2016 which saw a rally to test recent highs before a larger decline.


The NDX ETF pair SQQQ/TQQQ is even more extreme with ST sentiment at levels last seen before the recent rally that retraced 80% of the original decline.  Note that bearish sentiment had been rising for several months before the top.


II. Options Open Interest

This week I am going to take a look at the next two weeks Friday's OI as well as a three month look ahead for the VIX options OI.

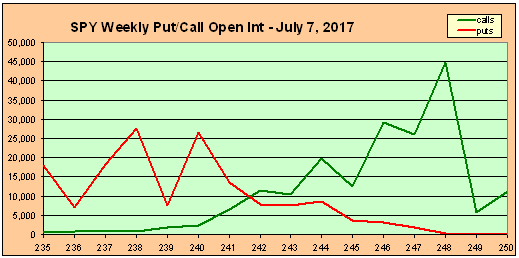
First for Friday July 7, the most likely range seems to be 240.5 to 244 (SPX 2410 to 2445) with 242-3 most likely.  Support is strong at 240 and resistance at 246.


For the next week, the support remains strong at 240, but resistance fades away, leaving a clear path to 245 or higher.  If the market is to start a new move upwards this is probably the week it happens.


Over the last two years, several times I have mentioned using the VIX P/C as warning sign when it reaches low levels (<.30 EMAs), but the more important factor are jumps in call daily volume to 500k or more (avg 250k).  The following chart shows the values for the last two weeks, note after a decline high volume of calls and puts mean dumb money buying calls while smart money buys puts.


What I noticed as particularly interesting was that Monday and Tuesday before the market dropped there was a large drop in the Total P/C ratio reported intra-day by the CBOE.  When you looked at the web page for 06/27, Google drive link, you can see that the total P/Cs dropped from .83 at 11 am down to .65 by 12 pm.  As it turned out someone was buying about 400k of VIX calls before dumping enough stock to drive the SPX from 2440 down to 2420.  I did not check the current option chain, but scrolling down through the document none of the listed categories showed an increase in call volume except Total and Index, where both include VIX options.

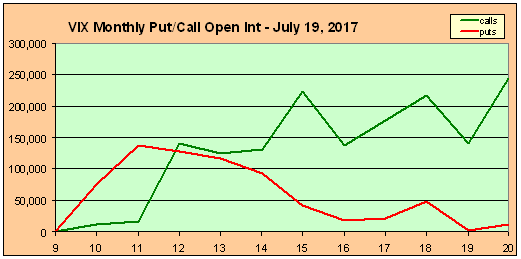
Anyway, this made me decide to look at the VIX options OI with the following data stored from Wed afternoon.  If VIX call buyers are smart money hedging their sell programs, the info may be better that that from the SPY.  So here goes.  Note OI size drops about 50% for each forward month, so forward months may change.

Starting with the July VIX OI, the most likely range is 11 to 14 with strong resistance at 15.  When I saw this I started to worry, but little did I know that we would gap down the next day and hit VIX 15 in the afternoon.  For some reason these expire on Wed, two days before SPY.  Only strong support level at 11 means VIX can drop back down to 10-11.


Looking at August, we see a cup formation that is likely to lock the VIX between 11 and 15 with most likely 12-14.  This seems to rule out the strong decline that everyone is looking for at least until the second half of August.


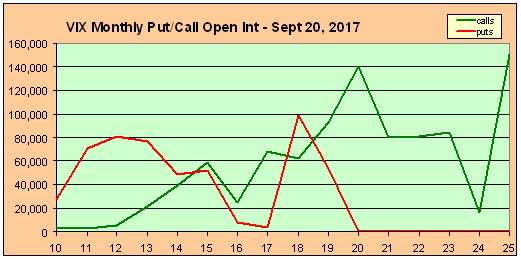
For September it gets down right scary.  Here, there is strong support at 14 with very little resistance until 20.  Apparently the smart money is expecting something big to the downside between mid-Aug and mid-Sept.  For comparison to 2014, the 100 pt SPX drop in Aug produced a VIX of 18 and the 200 pt drop in Oct produced a VIX of 30.


III. Technical Indicators

Today I just want to briefly mention the use of price gaps simply because the market seems to be almost frenetic about filling them.  The following two charts are from Friday for the SPX and NDX using hourly charts from Marketwatch.


The SPX has a short term gap from Friday's open at 2420, my preference is a rally to 2440 then a sharp decline to fill next week.  This would setup an inverse H&S as well as increase bearish sentiment.  The remaining gap is from two weeks ago at 2453, this implies a test of the ATH, but when?


The NDX, however, has already filled its Friday gap but has two gaps at higher levels at 5750 and 5775, but when will they be filled?  A large gap also looms at 5400 from April.

Conclusions.  Sentiment is not as strong as I would like to support a rally, but the 3X ETFs could support a rally up to 2450 to 2475.  I still like the 2014 comparison, updated on Twitter, which points to one more high around July 21.   The SPY options OI also shows upside promise after next week, so a sideways consolidation next week between SPX 2420-40 is likely to surprise to the upside.  I don't like to depend on EW, but the breakout from the SPX April bull flag could turn into a 5 wave affair with 1=70 pts, 3=90 pts, and 5=70 pts gives 2475.  More interesting from a timing perspective is that the VIX options OI supports an extension of time out to late Aug before a 4-5% decline, which leaves plenty of time for an additional rally phase.  I am leaning 60/40 up/down at this point.

Weekly Trade Alert.  Two potential trades for next week are to short a move to SPX 2440/5 looking to fill the gap at 2420 if not filled first.  The second is to go long if 2420 is retested for a longer term trade (two weeks) targeting the 2450-75 level with a stop just below 2405 or even 2410.   Updates @mrktsignals.

Article Index 2017 by Topic
Article Index 2016 by Topic

© 2017 SentimentSignals.blogspot.com