A combination of unemployment and economic uncertainty with racial tension have turned the US headlines into a repeat of last summer's headlines about the rioting in HK, Trump has already shown that he is all bark and no bite with respect to the new "national security" law in China regarding the HK dissenters and China is likely to continue its political aggression prior to the US elections.
I. Sentiment Indicators
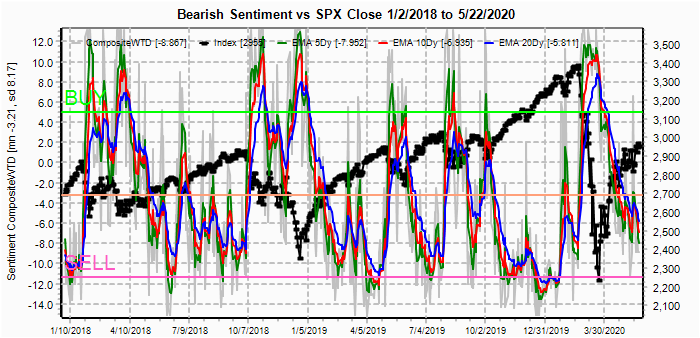
The overall Indicator Scoreboard (INT term, outlook two to four months) bearish sentiment continues to fall, albeit at a slow pace. Current sentiment is in between the areas where retests of previous declines began and pullbacks of larger rallies occurred.

The INT view of the Short Term Indicator (VXX $ volume and Smart Beta P/C [ETF Puts/Equity Calls], outlook two to four months) bearish sentiment is nearing the SELL area.

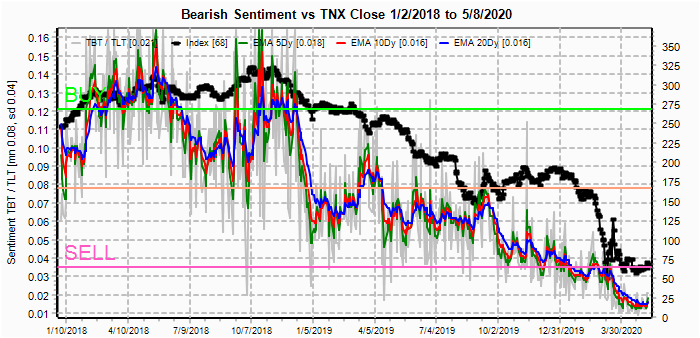
Bonds (TNX). Interest rates and sentiment continue to move sideways.

For the INT outlook with LT still negative, the gold miners (HUI) bearish sentiment has started to rise as the HUI as fallen 10%.

II. Dumb Money/Smart Money Indicators
The option-based Dumb Money/Smart Money Indicator as short/INT term (outlook 2 to 4 mns/weeks) has reached levels corresponding to major tops over the last two years, but lack of support of other indicators may indicate more of a sideways movement in SPX.

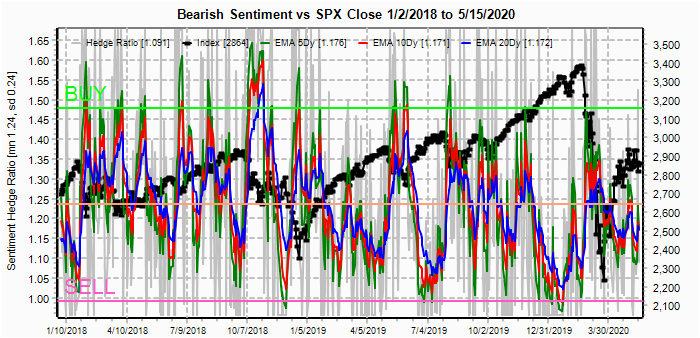
And the sister options Hedge Ratio sentiment is still showing a significant amount of hedging and is supportive of prices near current levels with limited downside expected.

Another put/call ratio that I don't report very often is the combined P/C or CPC Revised (less VIX puts and calls). The CPC Revised is probably the most accurate indicator as to the overall market risk and is currently at lower levels than any the last two years, except Jan-Feb 2020. Remaining at these levels or lower for a few weeks is a likely indicator of a retest of the Mar 2020 lows.

III. Options Open Interest
Using Thur closing OI, remember that further out time frames are more likely to change over time, and that closing prices are more likely to be effected. Delta hedging may occur as negative reinforcement when put support is broken or call resistance is exceeded. This week I will look out thru Jun 5. Also, This week includes a look at the GDX for Jun exp.
With Fri close at SPX 3044, options OI for Mon are small with call resistance at 3050 and put support at 2900. Some downward pressure is present toward the 3000-30 level.

Wed has also has small OI where SPX has call resistance at 3030 and little put support. A drop to the 2975-3000 level is possible.

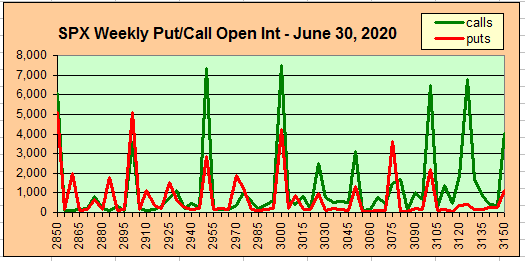
For Fri, larger OI may influence weekly behavior, but also shows strong call resistance at 3030 and a downward bias below 3000, and the straddles between 2900 and 3000 give downward bias toward 2950-3000.

Looking further out to the end of June, a move over 3050 could push to the 3075 put support level, but below 3000, prices are likely to fall between the put support at 2900 and call resistance at 2950.
Using the GDX as a gold miner proxy closing at 34.3, two weeks ago at 36.5, I indicated that the move into call resistance could see a whipsaw lower and since then prices have fallen to the first level of minor support. Additional price pressure toward the 30 level or lower is likely.

Currently the TLT is 163.6 with the TNX at 0.65%.
IV. Technical / Other
One simple chart for LT volume analysis. The NYUPV/DNV continues to rise similar to late 2015, indicating the increased potential of a longer term bull market, but does not rule out a retest similar to Jan/Feb 2016. In each of bottoms off major corrections since 2016, the strength of the rallies followed strength of the NYUPV/DNV.

Conclusions. Plenty of potential exists for political and economic upheavals over the next few months prior to the Nov elections. It is likely that China will continue it's aggressive political posture, forcing Trump to "put up or shut up" with likely negative consequences for US stock markets. For several months, I have indicated expectations for the retest of the Mar lows in the Fall with potential highs in the SPX 3100-300 prior to a correction/retest and still concur.
Weekly Trade Alert. A pullback lasting several weeks may begin next week, but it is likely to be disappointing to the bears with limited downside, probably the 50 SMA (currently 2770, but rising). Updates @mrktsignals.
Investment Diary, Indicator Primer,
update 2020.02.07 Data Mining Indicators,
update 2019.04.27 Stock Buybacks,
update 2018.03.28 Dumb Money/Smart Money Indicators
Article Index 2019 by Topic, completed thru EOY 2020.02.04
Article Index 2018 by Topic
Article Index 2017 by Topic
Article Index 2016 by Topic
Long term forecasts
© 2020 SentimentSignals.blogspot.com