Saturday, June 30, 2018

Let the Trade Wars Begin

We got the break of everyone's expected lows in the SPX 2720s down to the 2675-2700 area (lows 2698 and 2692) on Mon and Wed as forecast last week.  The big question is "are the lows in for now".  Thur and Fri saw a big uptick in put/call ratios where I warned on Twitter Thur AM with the SPX around 2700 that a rally could be expected to 2750+ and the next 24 hrs did make it to 2743.  Sentiment continues to mimic the Nov-Dec 2015 time period that shows a short covering rally could start soon, but several options are available for a bottom discussed in the conclusions.

I. Sentiment Indicators

This week I am taking a long term look at the Indicator Scoreboard and Short Term Indicator back to the 2015 period.  The overall Indicator Scoreboard (INT term, outlook two to four months) rose sharply nearing the BUY level.  Comparing the flash crash of Aug 2015 to the Feb 2018 drop, the June 2018 sentiment lows (price highs) fell below the early Nov 2015 sentiment lows, but has now rallied strongly matching that of the Nov 2015 SPX selloff.


The INT view of the Short Term Indicator (VXX $ volume and Smart Beta P/C, outlook two to four months) also rallied sharply last week almost reaching the mid-Dec 2015 levels.  In both cases, the 2015 analog would argue for a clearing rally to SPX 2770-80 to reset sentiment before a much larger decline is likely.


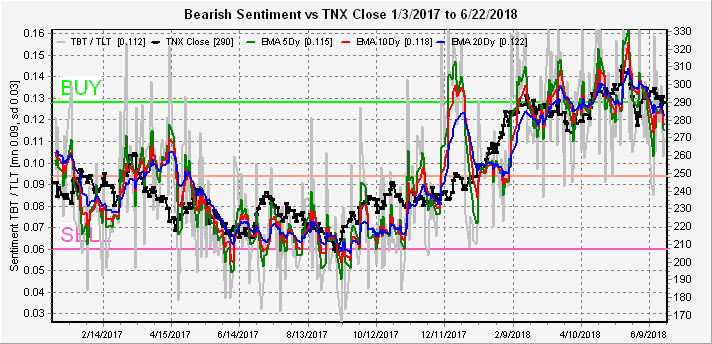
The high bearish bond sentiment (TNX) has continued to produce a consolidation in interest rates much as the low sentiment did for lower rates in mid to late 2017.


For the INT outlook with LT still negative, the gold miners (HUI) bearish sentiment fell sharply as prices rebounded Friday.  Given the recent period of modestly high bearish sentiment, more upside is possible but not likely to be the beginning of a major uptrend.


II. Dumb Money/Smart Money Indicators

The Risk Aversion/Risk Preference Indicator (SPX 2x ETF sentiment/NDX ETF sentiment, outlook 2 to 4 days/hours) as a very ST indicator continues to languish in neutral territory, but well off the recent lows.


The option-based Dumb Money/Smart Money Indicator as short/INT term (outlook 2 to 4 days/weeks) has reversed sharply from the lowest level of the year two weeks ago to matching the late March SPX lows.  The mid-Mar to mid-Apr chop is pretty much what I expect thru the July earnings season.


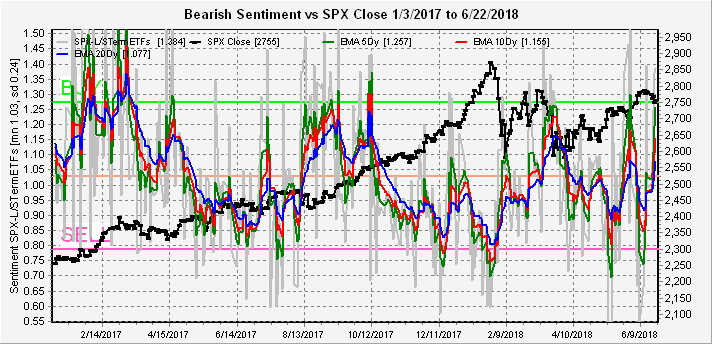
The INT term SPX Long Term/Short Term ETFs (outlook two to four weeks) rose very sharply due to strong selling in the 2x SDS/SSO sentiment while the 3x sentiment remained near neutral.  This one is more difficult to interpret, but similar levels in Apr and Aug of 2017 saw choppy prices followed by rallies.


The INT term NDX Long Term/Short Term ETF Indicator (outlook two to four weeks) is now up to the July 2017 lows in the NDX.


III. Options Open Interest

Using the Thur closing data.  SPX option open int worked well for last Mon/Wed showing little put support above SPX 2700, while Fri closed right at put support near 2720.

With Wed a holiday, options are for Mon/Tue which are very light, and Fri.  For Mon, there is put support below SPX 2730 with large put position at 2760 that can act as a magnet if 2730 is exceeded.  Could be a strong day.


For Tue, with extremely small option size and half trading day, the chart shows a "weak expected" SPX 2750 close and a potential range of 2690-2780.


Fri has large option contract size and since July 6 is the official start of the trade wars, some pullback might be expected.  But options open int shows strong put support at SPX 2700 and 2725 with fairly strong resistance at 2750, so a likely range of 2725 to 2750 is expected.


Conclusions.  Last week saw a 100 pt pullback similar to Nov 2015 with intra day volatility sending bearish sentiment soaring, but still much less than Aug 2017.  Sentiment indicators are all over the place with short term bullish targets from the option-based DM/SM Indicator and SPX options open int to SPX 2750-60.  The most likely INT outcome is a chop for most of July between lows of SPX 2675-2700 and 2750-60, followed by a breakout to the upside to reset bearish sentiment before a larger decline.  It is likely that the SPX 50, 100 and 200 day SMAs converge before a large decline.

Weekly Trade Alert.  None.  Mon could see a small opening decline with SPX 2700 a possible inverse H&S target as well as 2716 to fill an opening gap, but a following move up over 2730 could reach 2750-60 by EOD.  Updates @mrktsignals.

Investment DiaryIndicator Primer,  update 2018.03.28  Dumb Money/Smart Money Indicators
Article Index 2018 by Topic
Article Index 2017 by Topic
Article Index 2016 by Topic
Long term forecasts

© 2018 SentimentSignals.blogspot.com

Saturday, June 23, 2018

An Important Top May be In

Last week I was looking for a slightly higher high (SPX 2800+) before an INT decline began, but Trump's announcement of an additional round of tariffs against China may have aborted that move.

Looking at some historical background, this is the second trade war between China and the West.  The first trade war, known as the Opium Wars 1 and 2.  Britain started trade with China in the 1600s, mainly the purchase of tea, porcelain, and silk.  Over the years China ran up a huge trade surplus that finally led to a shortage of silver in Britain, so the East India Company devised a plan to import opium from India to sell in China.  This corrected the trade imbalance but created a country of opium addicts and in the mid-1700s China declared the sale and smoking of opium illegal.  After little progress, in 1830 the Chinese emperor confiscated 1,200 tons of opium from British ships and blocked foreign trade.  The British in retaliation declared war, sending their navy to crush Chinese resistance and force agreement to very unfavorable trade terms.  In the second war, Britain was joined by the US, Russia and France with similar results.  No wonder China is building up a military presence in the China seas.  This was around the time that the US fought a war with Mexico, seizing Texas and California (the two most populous states), perhaps if things had turned out differently, Mexico would be having problems with US immigrants.  Of course, we owe lax regulation of big pharma for our current opioid crisis.

Today I am going to add some historical charts for sentiment comparison to the 2015 for several of the indicators.

I. Sentiment Indicators

The overall Indicator Scoreboard (INT term, outlook two to four months) rose sharply with last weeks pullback by a similar amount to the May pullback, but also similar to the early stages of the Aug 2017 volatility.


Looking back to the 2015 period for some clues, starting with the Aug flash crash compared to the Jan-Feb 2018 crash, there is a lot of similarity between now and early Nov 2015 where a failure of the Aug 2015 low retest to make new highs several months later was followed by a sharp downturn of 4-5%.  From what I remember, in 2015 everyone was expecting the SPX to continue on to 2300-400, similar to today's calls for 3000+.


The INT view of the Short Term Indicator (VXX $ volume and Smart Beta P/C, outlook two to four months) saw a much smaller bounce, indicating that a much larger decline is likely needed to duplicate the huge jump in bearish sentiment seen in Aug 2017.


Bearish bond sentiment (TNX) is well off its highs as rates have stabilized around 2.9% for now, providing a neutral background for stocks..


Returning to the INT outlook with LT still negative, the gold miners (HUI) bearish sentiment spiked briefly then fell again as prices rebounded Friday.


II. Dumb Money/Smart Money Indicators

Continuing with the longer term (INT) sentiment picture.  The Risk Aversion/Risk Preference Indicator (SPX 2x ETF sentiment/NDX ETF sentiment, outlook 2 to 4 days/hours) remains near the INT SELL level within a downward sloping trend since Jan, now slightly  exceeding the level of July 2017.


The option-based Dumb Money/Smart Money Indicator also saw a sharp bounce matching the Indicator Scoreboard that could mean a weak bounce (SPX 50+ pts from low) or a continuation downward in prices until a BUY is reached.


The INT term SPX Long Term/Short Term ETFs (outlook two to four weeks) rose sharply last week reaching the level of the May low that may mean a bounce or could follow the pattern of July 2017 with new lows.


The INT term NDX Long Term/Short Term ETF Indicator (outlook two to four weeks) saw bearish sentiment continue higher last week buoyed by Dumb Money (2x) selling and Smart Money (3x) buying.


III. Technical Indicators, Other

This week I want to take a closer look at some of the SPX ETF indicators comparing 2015 to 2017-18.  Starting with the SDS/SSO ETF (2x) sentiment in 2015, you can see that the SELL level was reached several months before the May top with a secondary low a month before the Aug crash.  Following the crash, a SELL was not reached until a month after the rebound top in early Nov with a secondary low right before the Jan decline.


Moving to 2017-18, a SELL was reached in Oct with a secondary low in Dec, both well before the Jan top and similar to 2015.  Currently, sentiment is well away from a SELL, but is at the same level as the Nov 2015 top.  This has kept me from becoming immediately bearish, but if the 2015 analog continues, a larger decline than expected may currently unfold (SPX 2675-2700), followed by a sharp rally that fails (SPX 2770-80) but drops bearish sentiment to a SELL.


Looking at the SPXU/UPRO ETF (3x) sentiment for 2015, we see a similar pattern, but the 2x Dumb Money seems to be the better contrary indicator.


For 2017-18, again we see a sentiment SELL well before the Jan high with secondary sentiment lows in Dec.  Current sentiment is also near the Nov 2015 level.


 IV. Options Open Interest

Using the Thur closing data.  Mon has very small open int size with small put support up to SPX 2770 and large resistance at 2790 and 2800 similar to last Fri.  I wonder if someone is expecting "unexpected news" such as the dropping of the FBI investigation into the Trump/Russia connection.  Resistance can be used for a "pop and drop" with little put support until 2725.


For Wed, support and resistance show an expected close at SPX 2765, but there is little support below 2750 until 2700.


For Fri, open int is large with overlapping positions between 2750-80 that largely cancel out.  Larger resistance is at 2790 with support at 2725.  For the week the relevant range looks to be SPX 2725-90.


Last week I forgot to mention the Wed monthly VIX options open int (wrong title), but it showed the possibility of a move to 15 with Tue high at 14.68.


Jul 18 monthly is about the same.


Conclusions.  Trumps second salvo at China in the new trade war may have aborted the run to SPX 2800+.  The links to the previous trade war may give some background supporting China's reluctance to comply, and I doubt if will be as easy to win as Trump expects.  A "pop and drop" is still possible but may only reach SPX 2790-2800.  More worrisome are the comparisons to 2015 where several of the INT indicators look analogous to Nov 2015 that point to a possible drop to 2700 or lower to be followed by one last abortive run toward 2800.

Weekly Trade Alert.  No specific targets for this week.  A drop toward SPX 2675 would be a ST BUY, while 2790 would be a SELL.  Trading range 2730-80 possible.  Updates @mrktsignals.

Investment DiaryIndicator Primer,  update 2018.03.28  Dumb Money/Smart Money Indicators
Article Index 2018 by Topic
Article Index 2017 by Topic
Article Index 2016 by Topic
Long term forecasts

© 2018 SentimentSignals.blogspot.com

Saturday, June 16, 2018

An Important Top is Near

Last week continued to follow the July 2017 analog for both SPX prices and SPX ETF sentiment.  As shown in the technical indicator section and options open interest, the analog may be pointing to a top Fri June 22 or Tue Jun 26 ( a bradley turn date, middle).  Otherwise sentiment is equivalent to the Dec 2017-Jan 2018 topping period, so other than another melt up/melt down scenario an INT top should soon be in.

I. Sentiment Indicators

The overall Indicator Scoreboard (INT term, outlook two to four months) continued to fall with the 20 dy matching July 2017 and the shorter EMAs matching Dec-Jan 2018.


The INT view of the Short Term Indicator (VXX $ volume and Smart Beta P/C, outlook two to four months) also continued to fall, now nearing the July 2017 levels.  Remember that the Aug 2017 decline, although relatively mild, sent bearish sentiment sky rocketing to levels matching the Aug 2015 flash crash.  The result was my calling for a possible melt up in prices, but I do not expect sentiment to be as extreme this time until prices drop below the "triangle" lower boundary, now around SPX 2600.


Bearish bond sentiment (TNX) fell sharply last week with rates around 2.9% then rebounded later in the week.  Sentiment has now fallen to a level where another move up over 3.0% could start any time.


Many analysts are now calling the 18 month sideways action in gold stocks a "basing period" before a large reflation rally, so this week I want to look back to 2014-15 where a similar 6 month basing period did not rally (just the opposite).  Considering that bearish sentiment is lower now than then, I think the 2015 results may be more likely.


II. Dumb Money/Smart Money Indicators

This week since I am expecting an INT top, I want to look at the longer term (INT) sentiment picture.  The Risk Aversion/Risk Preference Indicator (SPX 2x ETF sentiment/NDX ETF sentiment, outlook 2 to 4 days/hours) has now reached the INT SELL level within a downward sloping trend since Jan, now slightly  exceeding the level of July 2017.


The option-based Dumb Money/Smart Money Indicator has now matched the level seen at the Jan top, only exceeded briefly in Dec 2017, and much lower than July 2017.


The INT term SPX Long Term/Short Term ETFs (outlook two to four weeks) continues to follow the pattern of July 2017 where the bearish sentiment rose to the mean in the middle of the consolidation period.


The INT term NDX Long Term/Short Term ETF Indicator (outlook two to four weeks) continues to remain above neutral as AMZN and NFLX continue to "dump" their services in foreign markets to gain market share and drive out the competition.  I wonder how long it will take our trade partners to figure out the the US has converted to a service based economy, especially in the tech sector, and that a more proper response for retaliation against our "manufacturing based" tariffs is tariffs against our "service based" sectors that are dominating world trade.  Otherwise sentiment seems to indicate that tech may be relatively immune to any trade war and may provide a "port in the storm".


III. Technical Indicators, Other

Last weeks report on the interest rate outlook seemed to be answered by the Fed on Wed by giving the rest of the world the fat finger.  Since Trump appointed the new Fed chairman and several Fed governors I felt that was a possibility and the focus now seems squarely on "USA first".

This week I want to take a closer look at the July 2017 SPX analog.  From the early July low ,the SPX rallied 15 days, taking a 20+ pt dump on the sixteenth day (Jul 27), recovering most of the loss, then continued upward for 7 days, ending with a 10 pt spike above what had been a 15 pt trading range.  Comparing to June 2018, from the recent low in May of SPX 2676, the market rallied 13 days before taking a 20+ pt dump Fri, recovering most of the loss, after trading in a 15 pt range of 2776-91.  The next question is whether we see a similar spike high that would probably be 10-5 pts above the recent range (2801-06), then reverse?  An additional 7 days is Tue 26th, while SPX options open int (below) hints at a possible Fri 22nd high above 2800.


I am not going to include a chart, but we have had about a month of very low VIX call buying, so there is no indication of a Jan-Feb crash.  Surprisingly, we saw a similar pattern in July 2017.

 IV. Options Open Interest

Using the Thur closing data.  Last weeks Twitter updates indicated increasing put support in the SPX 2760-85 area, reducing downside risk.  Mon has very small open int, but put support is SPX 2770-5 and call resistance is 2785-90.  So we may stay around the 2780 level.


Wed has about twice as many contracts with moderate (overlapping) resistance at SPX 2780, but stronger resistance at 2800.


Fri is where it gets interesting, where there are about 5 times as many contracts as Wed and major resistance is at SPX 2805-10 with almost no support until 2725.  The 45K contracts at 2820 were added Wed at a price near $3, so it makes me believe this may be "smart money" since the total value is over $12 million, but an early move over 2800 could be sold quickly, setting a sharp reversal.  Wed-Fri could provide a possible high.


The following Fri Jun 29 (EOM) is somewhat more intimidating with large open int where there is strong resistance at SPX  2770 and less at 2750, but little support until 2730.  A decline to SPX 2730-50 seems likely.


Conclusions.  The overall sentiment picture has cleared up considerably since last weeks update with an almost unanimous top warning for the SPX.  Continuation of the July 2017 analog points to a possible spike high for SPX of 2800-10 that is likely to reverse sharply by the EOM.  The outlook for the NDX is less clear and may continue to outperform with weakness related to "trade wars", but remains more susceptible to duration or interest rate risk due to high P/Es.  Bond sentiment has weakened enough that we could see a move back over 3% this summer if growth/inflation moves higher.

Weekly Trade Alert.  I hope people realize that no guidance as last week means less certainty in outlook due to conflicting sentiment signals.  This week has much stronger sentiment outlook for a top soon and reversal.  Looking for a move over SPX 2800, up to 2810, to short, possible Wed-Fri with an EOM target 2730-50.  Updates @mrktsignals.

Investment DiaryIndicator Primer,  update 2018.03.28  Dumb Money/Smart Money Indicators
Article Index 2018 by Topic
Article Index 2017 by Topic
Article Index 2016 by Topic
Long term forecasts

© 2018 SentimentSignals.blogspot.com

Saturday, June 9, 2018

No Mans Land

Last week exceeded my upside target slightly with the SPX closing at 2779, over the 2750-75 target zone.  Short term sentiment does not indicate an immediate top, however, but technically since the "triangle" has been broken the next possibility is a "b-wave" correcting the Jan-Feb drop that could reach the 2820-30 area before a drop into the 2400s.

My information about the SPX options updates proved to be incorrect as updates do not seem to be available until the next business day, so I will continue posting on Sat using the Thur closing open interest.

I. Sentiment Indicators

The overall Indicator Scoreboard (INT term, outlook two to four months) fell sharply last week with the 5 dy EMA reaching the SELL area.  Still following the July 2017 sentiment pattern, a continuation of the upward consolidation is likely for the next 1-2 weeks.


The INT view of the Short Term Indicator (VXX $ volume and Smart Beta P/C, outlook two to four months) also fell, but is well short of the July 2017 lows that may allow for higher SPX prices.


Bearish bond sentiment (TNX) remains at high levels, but is nearing the 0.11 to 0.12 range that has recently allowed rates to continue higher.


The gold miners (HUI) bearish sentiment fell sharply as early fears of emerging market contagion may have encouraged safe haven buying, but not enough to positively effect prices.


II. Dumb Money/Smart Money Indicators

The Risk Aversion/Risk Preference Indicator (SPX 2x ETF sentiment/NDX ETF sentiment, outlook 2 to 4 days/hours) as a very ST indicator fell sharply at the end of the week with a strong pickup in dumb money buying in the SPX ETFs (2x).  The last similar occurrence with a strong rally was May 10 that was followed by a two week consolidation around SPX 2725 and this would be consistent with the July 2017 analog.


The option-based Dumb Money/Smart Money Indicator as short/INT term (outlook 2 to 4 days/weeks) has remained modestly negative for the last month, a pattern similar to Jan, but less extreme, that may be indicating an INT turn.


The INT term SPX Long Term/Short Term ETFs (outlook two to four weeks) fell sharply last week, completing the pattern of July 2017 reached at the top of that BUY spike.


The INT term NDX Long Term/Short Term ETF Indicator (outlook two to four weeks) remains in a neutral position, different than the SPX, but is also following patterns seen at the May 2017 and Jan 2018 tops where SELLs were not given before sharp declines..


III. Technical Indicators, Other

Is history repeating itself.  It's only been about five years since a combination of FED "tightening" and stronger economy pushed the TNX interest rate from 1.5% to 3.0%.  The result was pandemonium in the EU and EM markets (remember Grexit, now it's Itexit).  As a result the FED backed off and markets took off.  Will this time be different?

First looking at the bond (TNX) market, this time using the moving avg adj due to decay factor LT in the 2x TBT.  From Oct 2013 thru Apr 2014, the early run up in rates to 2.7% produced the highest bearish sentiment (like a MACD), that then stabilized even as rates rose over 3.0%.


Comparing this to now, we saw the early spike in sentiment with the rise to 2.9%, followed by a decline and a higher rate spike over 3.0%.


So what happened to the SPX when rates spiked higher in 2013-14?  We are now probably at comparable levels in the rate cycle to Oct 2013.  So a lot depends on where the FED goes from here.  If policies allow the TNX to stabilize around 3.0% stocks may continue higher, but tighter policies that push the TNX higher will not be as friendly to stock prices.


IV. Options Open Interest

Using the Thur closing data.  SPX option open int was of limited use last week as all except the strongest call resistance at 2780 was overcome.  Next week has moderate open int size.  For Mon, the SPX has strong put support at 2740 and strong call resistance at 2780 and 2790, so a slight pullback is expected between support and resistance.


For Wed, a moderate amount of calls at SPX 2750 and 2760 may push prices below those levels with little support until the lower 2700s.  There is strong resistance at 2775.


For Fri PM, most significant is the strong resistance at SPX 2750, so any early week decline is unlikely to rise over 2750 on Fri.  There is some support at 2700.


Conclusions.  Prices last week slightly exceeded the SPX 2750-75 target topping area, but a combination of Risk Aversion Indicator SELL and options open int point to a small pullback next week into the SPX 2700-50 area.  The FOMC interest rate outlook next week may be an important factor in where interest rates are headed, hence the special section looking at TNX in 2013-14.

Weekly Trade Alert.  Mon is likely to open higher in the 2780-90 area before a pullback that may fall to the low 2700s, but is not likely the start of a significant decline.  No specific guideline.  Updates @mrktsignals.

Investment DiaryIndicator Primer,  update 2018.03.28  Dumb Money/Smart Money Indicators
Article Index 2018 by Topic
Article Index 2017 by Topic
Article Index 2016 by Topic
Long term forecasts

© 2018 SentimentSignals.blogspot.com