Saturday, May 26, 2018

Whipsaw Likely Ahead

The "news" supporting a possible rally last week was lacking with a standoff in the China trade agreement and a cancellation/delay of the N. Korea denuclearization talks for June 12.  The options open interest, Risk Aversion and DM/SM Indicators remain slightly negative for next week with a decline to SPX 2675-2700 likely by NFP Friday June 1, but the short/INT term ST/LT ETF Indicators for both SPX and NDX are approaching two to four week BUYs.  Conversely, the INT Indicator Scoreboard and ST Indicator are approaching two to four month SELLs.  The conclusion seems to be an end to the current pullback next week, then a rally into mid-late June before a multi-month pullback into the Fall.

I. Sentiment Indicators

The overall Indicator Scoreboard (INT term, outlook two to four months) stalled out last week around -8.0 with longer EMAs continuing to decline.


The INT view of the Short Term Indicator (VXX $ volume and Smart Beta P/C, outlook two to four months) continued to fall sharply last week nearing the level of late 2017.


Here the Smart Beta P/C is leading the way as the VXX $ volume lags which leads me to believe that the next sizable pullback will be a lower volatility water torture rather than a waterfall as seen in Jan-Feb.


Bearish bond sentiment (TNX) fell sharply last week as the TNX fell from 3.1% back to 2.9% and rates are likely to level off for the next couple of weeks to allow sentiment to drop further.  It still seems highly coincidental the sharp rate rises seem to coincide with confrontations with China, while declines follow any appeasement.


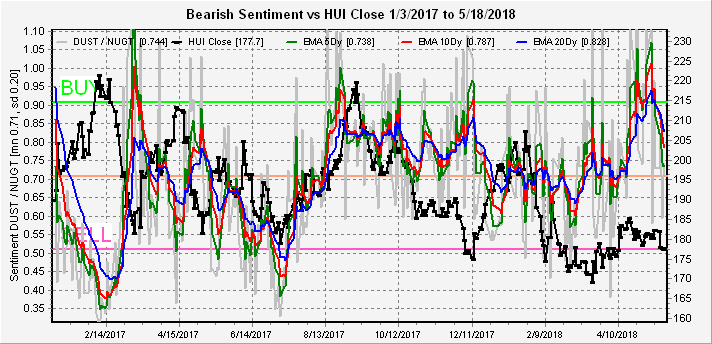
The gold miners (HUI) bearish sentiment leveled off around the short term neutral level as strength in the dollar seemed to offset lower interest rates.


II. Dumb Money/Smart Money Indicators

The Risk Aversion/Risk Preference Indicator (SPX 2x ETF sentiment/NDX ETF sentiment, outlook 2 to 4 days/hours) as a very ST indicator has declined to a moderate a SELL last week, indicating that somewhat lower prices are likely next week.  As a note for both SPX and NDX ETFs, splits occurred last week in the SPX SPXU and UPRO as well as the NDX QID and TQQQ, so there may be some distortion for the next couple of weeks, but nothing was apparent in the ETF data.


The option-based Dumb Money/Smart Money Indicator as short/INT term (outlook 2 to 4 days/weeks) dropped sharply on Mondays rally to a weak SELL but by Fri moved back to neutral.


The INT term SPX Long Term/Short Term ETFs (outlook two to four weeks) reversed from a low level last week to a moderate positive level during the week as Smart Money sentiment (ST) improved relative to Dumb Money (LT). 


The INT term NDX Long Term/Short Term ETF Indicator (outlook two to four weeks) rose even more sharply that the SPX ETF Indicator which probably means a run to new ATHs for the NDX (assuming no distortion from the splits).


III. Options Open Interest

The large call open int at SPX 2725 for Fri did provide too much resistance as expected with the puts at 2700 providing support and a close at 2721.  Next week is interesting with Memorial Day as a Holiday, we have exp for Tu/W/Th/F with Thur (EOM) and Fri (NFP) large open int.

For Tues, there's moderate call resistance starting at SPX 2725 and little support until 2700 which is the likely range.  Tue/Wed have small open int so may not have much effect on prices.


For Wed, the outlook is much the same although large call positions at 2745-50 and 2770 distort the graph.


For Thur (EOM), calls and puts offset each other at SPX 2675 and 2700 so there should be no net resistance/support between 2650 and 2725 which could contribute to volatility.


For June 1 (NFP), the large call position at SPX 2675 is likely to act like the 2725 position last Fri, pushing prices below that level for the close.  With next significant put support at 2660 prices could fall to 2650-60 with an expected close 2665-70.


The following Fri Jun 8 also has large open int with strong support at SPX 2700 and resistance at 2725, so a jump back to the current range is likely the following week.


Conclusions.  Two steps forward, two steps back seems to be the mantra of Trump's trade/foreign policy as very little was accomplished last week and the SPX responded by trading within the range of of the prior week losing 7 pts for the week.  Friday's option open int did predict the closing price for the week, and if next week follows, the SPX should close just below 2675 by Fri and rebound over 2700 the following week.  Sentiment is pointing to a possible double whipsaw, the first to fakeout the second version of the "triangle" shown here with a drop below SPX 2700 then a rally to the 2750-75 area in June and finally followed by a more serious decline to 2450-2550 by the Fall.  Avi Gilbert labels this as his red "alt" scenario.

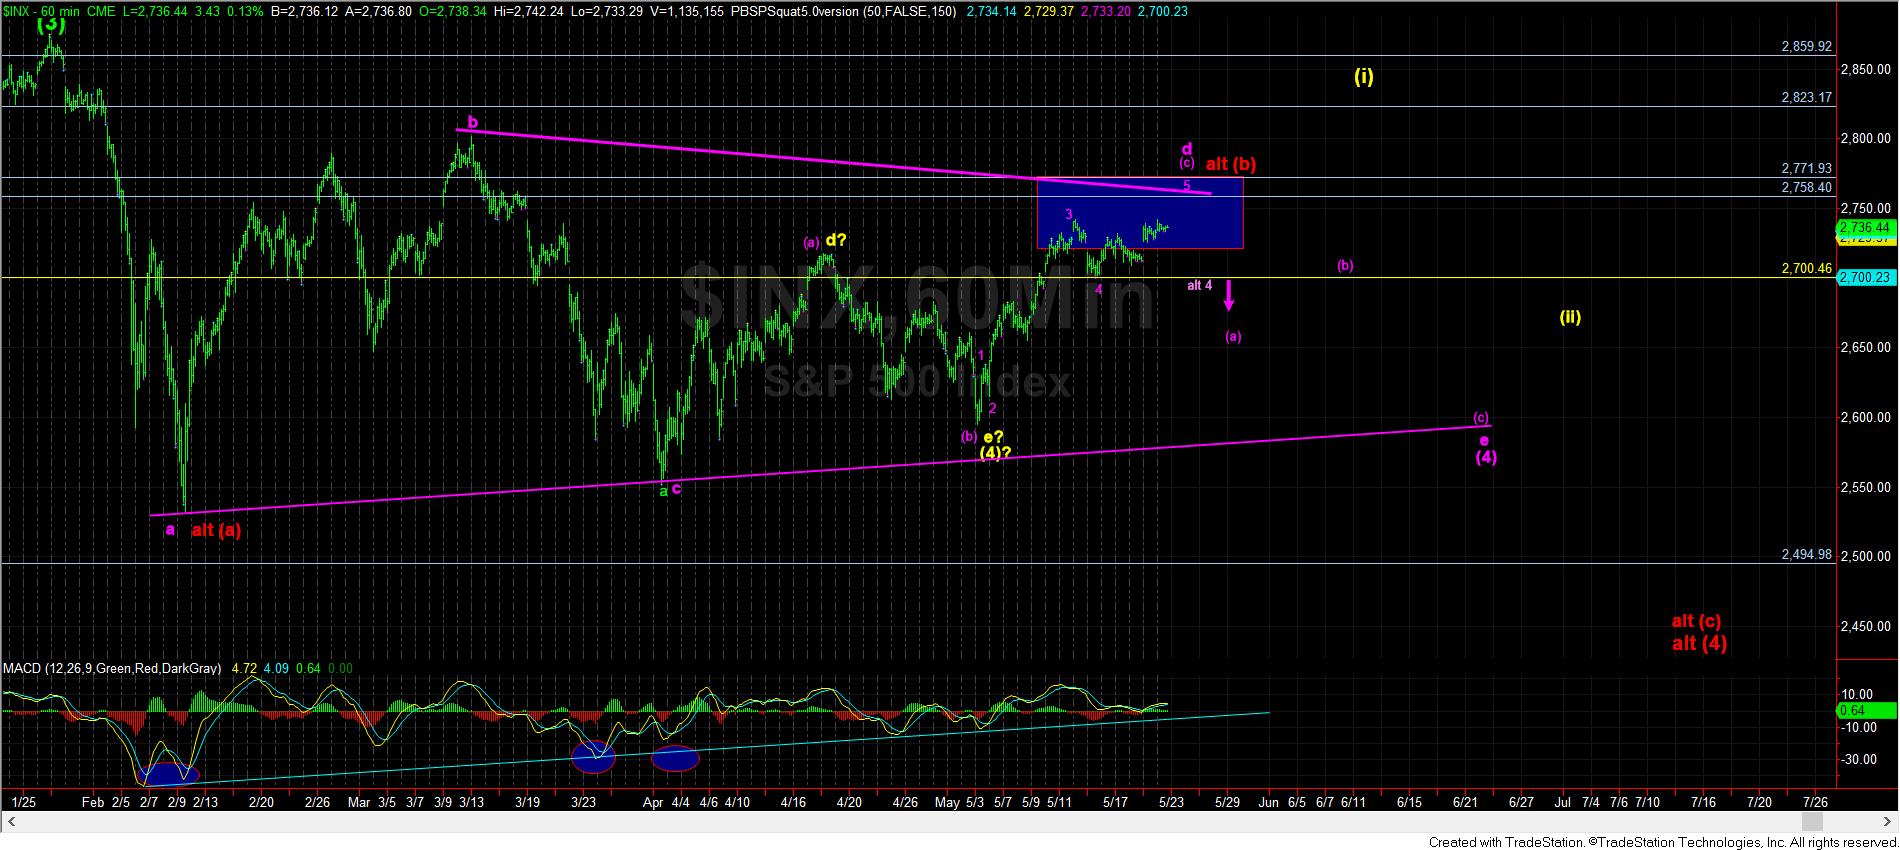
Weekly Trade Alert.  The "news" rally appears to on hold with the best reward/risk oppty next week a long (with sentiment support) in the SPX 2660-70 area with a potential 100 pt upside by mid-late June.  A good momentum trade would be to short a break below SPX 2700 targeting 2665-75 Thu/ Fri.  Updates @mrktsignals.

Investment DiaryIndicator Primer,  update 2018.03.28  Dumb Money/Smart Money Indicators
Article Index 2018 by Topic
Article Index 2017 by Topic
Article Index 2016 by Topic
Long term forecasts

© 2018 SentimentSignals.blogspot.com

Saturday, May 19, 2018

Death by 1000 Cuts

Last weeks guideline of little progress with a test of the triangle breakout at SPX 2700-10 was followed closely after a Mon rally to the possible topping zone of 2740-60.  A Risk Aversion Indicator SELL Mon (Twitter) was followed by a drop to 2702 Tue and the rest of the week was spent trading between 2710 and 2730, closing at SPX 2712.  Options open int shows the potential for a rally to SPX 2750+ by Wed but afterwards the direction is likely to be down through June 1 targeting SPX 2650-75.

I. Sentiment Indicators

The overall Indicator Scoreboard (INT term, outlook two to four months) continued to hang around the -8 level with longer EMAs continuing to decline.


The INT view of the Short Term Indicator (VXX $ volume and Smart Beta P/C, outlook two to four months) also continued to level out, this time around the zero level.  As mentioned last week, we may not see much lower levels if the pattern of rising bottoms holds.


Bearish bond sentiment (TNX) spiked last week as rates briefly rose to the 3.1% level before pulling back.  Rates seem to be stair-stepping higher with each pullback in sentiment, but overall sentiment is still considerably lower than the 2015 move in rates from 1.7% to 2.4%.


The gold miners (HUI) bearish sentiment surprisingly fell last week even as the HUI dropped from 182 to 178.  Remembering that the long term mean (from 2015-18) is 0.94, this has negative implications for the miners.


With the RUT being the only major index hitting ATHs, I thought it might be a good idea to take a look at the TZA/TNA ETF ratio.  Predictability has been somewhat erratic over the past year, but sentiment is similar to Oct 2017 so a ST top may be near.


II. Dumb Money/Smart Money Indicators

The Risk Aversion/Risk Preference Indicator (SPX 2x ETF sentiment/NDX ETF sentiment, outlook 2 to 4 days/hours) as a very ST indicator gave a SELL Mon (on Twitter late AM at SPX 2635) that was followed by a SPX 30+ pt decline the next day and has moved back to a TL neutral position.


The option-based Dumb Money/Smart Money Indicator as short/INT term (outlook 2 to 4 days/weeks) moved up sharply on Fri as a lot of options players seem to be looking for disappointing news over the weekend.  More likely the wink between China and Trump will be viewed as a positive (a wink is "do nothing but claim victory" vs a blink which is a tacit but unenforceable agreement) and the markets will rally early in the week.


The INT term SPX Long Term/Short Term ETFs (outlook two to four months) reversed from a very low level on Mon and rebounded during the week.  It's difficult to draw any conclusion, but the most likely outcome is limited upside / possible correction ahead.


The INT term NDX Long Term/Short Term ETF Indicator (outlook two to four months) remains below the mean showing a slight negative bias.


III. Options Open Interest

Last week's open int correctly indicated limited upside, but looking forward for the next two weeks lower prices are likely.  For Mon, there is very little net open int below SPX 2720 so the SPX could fall hard with most notable upside resistance at 2750.  Expected close is 2700.  Based on other sentiment I expect a move up to SPX 2730-50.


For Wed, the outlook is much the same with modest support at SPX 2600 and strong resistance at 2765 and 2775.  Expected close is 2720, but news could push prices as high as 2765-75.


For Fri with large open int, there is very large call resistance at SPX 2725 so it's unlikely the SPX closes higher that 2725 by Fri, so any news events Mon/Wed that push the SPX over 2750 would be a "sell the news" by Fri.


For the following Fri, Jun 01 (NFP), strong resistance at SPX 2675 indicates that prices should continue to fall thru the following week to the 2675 area.


Conclusions.  After a ho-hum week last week, the next couple of weeks are likely to be more exciting.  Depending on news events, likely China trade sanctions and N Korea nuclear disarmament, Mon thru Wed of next week could rally to SPX 2750-2775, but afterwards should target 2675 by June 1.  I hope to see a Risk Aversion SELL if there is a top.  This could be the breakdown from the triangle breakout to start a summer decline to SPX 2450-2550 by Sept following the Presidential cycle.  This would imply a strong year-end rally.  I expect the summer decline to be slow and painful as rising rates provide "1000 cuts" to bring the market down.  If markets do not rally next week then the top may be in at SPX 2742 for the summer.

Weekly Trade Alert.  Looking for a top SPX 2750-75 to short next week with a target of 2725 by Fri and 2675 a week from Fri.  There is a Gartley pattern suggesting SPX 2775 as a high.   Updates @mrktsignals.

Investment DiaryIndicator Primer,  update 2018.03.28  Dumb Money/Smart Money Indicators
Article Index 2018 by Topic
Article Index 2017 by Topic
Article Index 2016 by Topic
Long term forecasts

© 2018 SentimentSignals.blogspot.com

Saturday, May 12, 2018

Triangle Fakeout or Breakout?

A couple of weeks ago I showed the SPX consolidation formation (w4) as a Bermuda triangle because there were several interpretations.  One which was expected to be a fakeout breakout where the top descending line was drawn through the Jan SPX top at 2873 and the mid-Mar top at 2802 (simple triangle).  The breakout pt was near the SPX 100 SMA at 2706 and the break over that level saw the public (dumb money) panic into the market as sentiment indicators plummeted across the board.  The smart money seems to be looking at the EW interpretation as illustrated by Avi Gilbert  which is looking for a top around SPX 2740-50 as a W4 d-wave with an expected drop to SPX 2450-2550 to follow.  The latter is shown clearly this week with the SPX ST/LT Term ETFs as the 2x ETF sentiment fell much more than the 3x sentiment.

I. Sentiment Indicators

The overall Indicator Scoreboard (INT term, outlook two to four months) plunged from modestly bullish last week to neutral across the three time periods to moderately bearish very short term.  For an INT top (prior to 10%+ decline), I at least expect the green 5 dy EMA to reach -10 and the blue 20 dy to reach -8.  SPX is expected to work its way higher into late May.


The INT view of the Short Term Indicator (VXX $ volume and Smart Beta P/C, outlook two to four months) also declined, but not as drastically.  Looking over the past year, the previous bottoming periods for sentiment were at higher levels so sentiment may not drop much further.  This may mean that the next couple of weeks could be bumpy with an upward bias.


The ST view of the Short Term Indicator (VXX $ volume and Smart Beta P/C, outlook two to four weeks) shows sentiment levels at the lowest of the year outside of early Jan, we may see a very short term pullback early next week to test the simple triangle breakout at SPX 2700-10.


Bearish bond sentiment (TNX) has dropped over the last two weeks as rates consolidated just below the 3.0% levels as rates continue to track the 2 year notes since Oct 2017.


The gold miners (HUI) bearish sentiment remains elevated compared to the last year, but the 50% rise in rates (TNX) since late 2017 is providing strong headwinds to any advance.


II. Dumb Money/Smart Money Indicators

The Risk Aversion/Risk Preference Indicator (SPX 2x ETF sentiment/NDX ETF sentiment, outlook 2 to 4 days/hours) continues to be the best very ST indicator as the reversal of the modest SELLs of two weeks ago saw a strong move up prior to last weeks rally as posted on Twitter.  Now at the end of last week we've seen sentiment pullback again, warning of a modest pullback over the next few days, possibly to test the simple triangle breakout.


I have revamped the Dumb Money/Smart Money Indicator as short/INT term (outlook 2 to 4 days/weeks) which showed the bottoming potential of the last two weeks, but dropped sharply last week and may be repeating the sequence leading up to the Jan top.


The INT term SPX Long Term/Short Term ETFs (outlook two to four months) saw a sharp drop last week when the SPX 2x ETF (dumb money) bearish sentiment fell sharply while the 3x ETF sentiment (smart money) remained unchanged.  This looks a lot like the late July 2017 sentiment which consolidated for two/three weeks before the Aug pullback.


The INT term NDX Long Term/Short Term ETF Indicator (outlook two to four months) also fell but not as much as a couple of weeks ago before the sharp drop in the NDX, so more upside/consolidation is likely.


III. Technical Indicators/Other

Just as a followup to the Bermuda triangle.  Here the purple TL top is what the public is looking at while the red TL top is what the EW community is looking at.


IV. Options Open Interest

SPX options open interest was not very effective last week as I have noted that days where there is high OI tend to have a stronger influence similar to M/W/F two weeks ago where we had EOM/FOMC/NFP coinciding with high OI.  The next sequence with high OI is May 25 (?), May 31 (EOM), and June 1 (NFP).  Possibly we will have a May 25 top, drop into EOM then rally thru NFP.

For next week OI is light even this is optn exp week.  Mon, since the SPX is at 2728 positive delta hedging could push prices as high as 2750, or if the 2710 calls act as resistance they may push prices down to 2700.


For Wed, the story is much the same where calls control the action between 2655 and 2750, and the effect of the 2700 calls are likely to determine whether prices are higher or lower.


For Fri PM, strong overhead resistance moves up to SPX 2780, but given other sentiment indicators and DM/SM Indicators, most of the week may be spent consolidating around the SPX 2700 area with a move to higher levels delayed to the next week after bearish sentiment has a chance to reset.


Conclusions.  Instead of an early week rally to SPX 2700 followed by a pullback, the SPX pulled back to the 2650's Mon/Tue generating a positive outlook with the Risk Aversion Indicator as posted on Twitter, then rallied to breakout of the simple triangle that produced a sharp drop in bearish sentiment across the board.  Another modest pullback to test the simple triangle breakout over the next few days may reset sentiment before the next rally toward the SPX 2740-60 level.  Check for updates intra week on Twitter.

Weekly Trade Alert.  None at this time.   Updates @mrktsignals.

Investment DiaryIndicator Primer,  update 2018.03.28  Dumb Money/Smart Money Indicators
Article Index 2018 by Topic
Article Index 2017 by Topic
Article Index 2016 by Topic
Long term forecasts

© 2018 SentimentSignals.blogspot.com

Saturday, May 5, 2018

An Apple a Day

Last week's SPX trading pattern did not reach my upside shorting target of 2715ish, turning down from a Mon high of 2683 to a Wed low of 2595 (target 2575-2600), then back up to the options OI Fri target of 2670.  The story of the week was AAPL and although I was expecting an EPS upside surprise, did not anticipate the $100 billion buyback or the Buffet announcement of a $75 billion investment that pushed AAPL to new highs.  Tech enthusiasm has again pushed the Risk Aversion Indicator to an extreme were a sharp downturn might occur.

I. Sentiment Indicators

This week in general, I want to step back and longer term look at what might be expected in May and beyond.  The overall Indicator Scoreboard (outlook two to four months) is little changed for the week with a modestly positive outlook.


However, looking at the long term view (3 yrs, 5x EMAs) of the overall Indicator Scoreboard has failed to reach the bearish sentiment extremes of the Aug 2015 or Jan 2016 declines with the implications that the markets are still at the beginning of a longer term decline.


Switching to the INT view of the Short Term Indicator (VXX $ volume and Smart Beta P/C, outlook two to four months) bearish sentiment has continued to decline, but I expect a drop closer to the SELL area of -0.4 to -0.6 before high risk of the next 10+% decline occurring.


Looking at the LT view of bond sentiment (3 yrs, 1x EMAs), we have seen higher bearish sentiment as in mid-2015 before the top in a move up in rates.  The Fed has been talking about normalizing rates by moving the Fed funds rate to 3.0-3.5% and the TNX to 4% by 2020 and this may very well happen. The two and ten year continue to move in close fashion since late 2017.


Looking at the LT view of HUI sentiment (3 yrs, 1x EMAs), the last bull market did not start until the TNX started it's rate decline in Dec 2015, so even though short term sentiment looks positive, long term sentiment is only neutral.  Conclusion, the gold miners are not likely to outperform until the interest rate cycle reverses.


II. Dumb Money/Smart Money Indicators

The Risk Aversion/Risk Preference Indicator (SPX 2x ETF sentiment/NDX ETF sentiment, INT outlook) has continued to perform well on the very short term ending on a modest SELL last week before this weeks decline and has now moved into a modestly positive reading, indicating more upside is likely very short term.  The longer term shows a definite trend (yellow) that is pointing to a longer down trend.


The ST term SPX Long Term/Short Term ETFs (outlook two to four weeks) has moved back to neutral with diminished risk of a large decline, but no large rally expected either.


The ST term NDX Long Term/Short Term ETFs (outlook two to four weeks) saw a swift decline from the positive outlook early last week and is now warning of another pullback likely to start the next few days, but not as severe as the decline two weeks ago based on current sentiment.  Again we see a longer term trend, likely the source of the SPX/NDX ETF trend.


The options-based Dumb Money/Smart Money Indicator (outlook 2 to 4 days/hours) has not been as effective lately as the modest SELL has only resulted in opening declines that were reversed, but it is still warning of weakness ahead.


III. Options Open Interest

Last week's outlook worked like a champ with Mon slightly weaker than expected with a close slightly below SPX 2660 support, while Wed possible drop to 2600 occurred after hours and the Thur open, and Fri rallied back to the 2670 target.  Next week open interest is light so is likely to effect prices less. On Mon there's strong resistance at SPX 2700 and support at 2625 with an expected range of 2660-80, close 2670.


On Wed, the setup is very similar to last Wed with strong resistance at SPX 2700 and not much support until 2580, so another mid-week pullback may be in the cards.


On Fri, there is strong put support at SPX 2625 and below (2x M/W size) there is some call resistance between 2650 and 2700 and strong resistance at 2700 and above, expected close is overlap at 2650.


Conclusions.  Next week may end up similar to last week with less fireworks.  An upside continuation is likely Mon/Tue to SPX 2680-2700, followed by another test of the lower triangle boundary with options OI for Wed showing 2580 possible.  Size of pullback likely will depend on updated sentiment now pointing to only 2610-20, see Twitter for updates.  Rally into Fri is likely to be weak to the 2650 range.  My outlook had been for a continued rally into the end of month to SPX 2740-60 before a larger decline, but current sentiment seems to point to more consolidation.

Weekly Trade Alert.  Looking for early week rally to SPX 2690 +/- 10 to short, first target 2610-20, lower target possible 2580.   Updates @mrktsignals.

Investment DiaryIndicator Primer,  update 2018.03.28  Dumb Money/Smart Money Indicators
Article Index 2018 by Topic
Article Index 2017 by Topic
Article Index 2016 by Topic
Long term forecasts

© 2018 SentimentSignals.blogspot.com