
I. Sentiment Indicators
The overall Indicator Scoreboard (INT term, outlook two to four months) continued to hang around the -8 level with longer EMAs continuing to decline.

The INT view of the Short Term Indicator (VXX $ volume and Smart Beta P/C, outlook two to four months) also continued to level out, this time around the zero level. As mentioned last week, we may not see much lower levels if the pattern of rising bottoms holds.

Bearish bond sentiment (TNX) spiked last week as rates briefly rose to the 3.1% level before pulling back. Rates seem to be stair-stepping higher with each pullback in sentiment, but overall sentiment is still considerably lower than the 2015 move in rates from 1.7% to 2.4%.

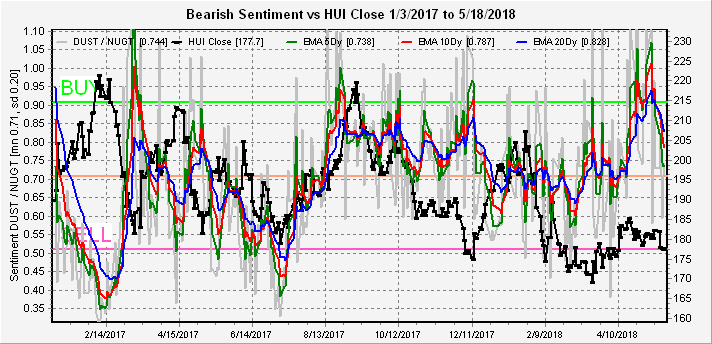
The gold miners (HUI) bearish sentiment surprisingly fell last week even as the HUI dropped from 182 to 178. Remembering that the long term mean (from 2015-18) is 0.94, this has negative implications for the miners.
With the RUT being the only major index hitting ATHs, I thought it might be a good idea to take a look at the TZA/TNA ETF ratio. Predictability has been somewhat erratic over the past year, but sentiment is similar to Oct 2017 so a ST top may be near.

II. Dumb Money/Smart Money Indicators
The Risk Aversion/Risk Preference Indicator (SPX 2x ETF sentiment/NDX ETF sentiment, outlook 2 to 4 days/hours) as a very ST indicator gave a SELL Mon (on Twitter late AM at SPX 2635) that was followed by a SPX 30+ pt decline the next day and has moved back to a TL neutral position.

The option-based Dumb Money/Smart Money Indicator as short/INT term (outlook 2 to 4 days/weeks) moved up sharply on Fri as a lot of options players seem to be looking for disappointing news over the weekend. More likely the wink between China and Trump will be viewed as a positive (a wink is "do nothing but claim victory" vs a blink which is a tacit but unenforceable agreement) and the markets will rally early in the week.

The INT term SPX Long Term/Short Term ETFs (outlook two to four months) reversed from a very low level on Mon and rebounded during the week. It's difficult to draw any conclusion, but the most likely outcome is limited upside / possible correction ahead.

The INT term NDX Long Term/Short Term ETF Indicator (outlook two to four months) remains below the mean showing a slight negative bias.

III. Options Open Interest
Last week's open int correctly indicated limited upside, but looking forward for the next two weeks lower prices are likely. For Mon, there is very little net open int below SPX 2720 so the SPX could fall hard with most notable upside resistance at 2750. Expected close is 2700. Based on other sentiment I expect a move up to SPX 2730-50.

For Wed, the outlook is much the same with modest support at SPX 2600 and strong resistance at 2765 and 2775. Expected close is 2720, but news could push prices as high as 2765-75.

For Fri with large open int, there is very large call resistance at SPX 2725 so it's unlikely the SPX closes higher that 2725 by Fri, so any news events Mon/Wed that push the SPX over 2750 would be a "sell the news" by Fri.

For the following Fri, Jun 01 (NFP), strong resistance at SPX 2675 indicates that prices should continue to fall thru the following week to the 2675 area.

Conclusions. After a ho-hum week last week, the next couple of weeks are likely to be more exciting. Depending on news events, likely China trade sanctions and N Korea nuclear disarmament, Mon thru Wed of next week could rally to SPX 2750-2775, but afterwards should target 2675 by June 1. I hope to see a Risk Aversion SELL if there is a top. This could be the breakdown from the triangle breakout to start a summer decline to SPX 2450-2550 by Sept following the Presidential cycle. This would imply a strong year-end rally. I expect the summer decline to be slow and painful as rising rates provide "1000 cuts" to bring the market down. If markets do not rally next week then the top may be in at SPX 2742 for the summer.
Weekly Trade Alert. Looking for a top SPX 2750-75 to short next week with a target of 2725 by Fri and 2675 a week from Fri. There is a Gartley pattern suggesting SPX 2775 as a high. Updates @mrktsignals.
Investment Diary, Indicator Primer, update 2018.03.28 Dumb Money/Smart Money Indicators
Article Index 2018 by Topic
Article Index 2017 by Topic
Article Index 2016 by Topic
Long term forecasts
© 2018 SentimentSignals.blogspot.com
No comments:
Post a Comment