
I. Sentiment Indicators
The overall Indicator Scoreboard (INT term, outlook two to four months) plunged from modestly bullish last week to neutral across the three time periods to moderately bearish very short term. For an INT top (prior to 10%+ decline), I at least expect the green 5 dy EMA to reach -10 and the blue 20 dy to reach -8. SPX is expected to work its way higher into late May.

The INT view of the Short Term Indicator (VXX $ volume and Smart Beta P/C, outlook two to four months) also declined, but not as drastically. Looking over the past year, the previous bottoming periods for sentiment were at higher levels so sentiment may not drop much further. This may mean that the next couple of weeks could be bumpy with an upward bias.

The ST view of the Short Term Indicator (VXX $ volume and Smart Beta P/C, outlook two to four weeks) shows sentiment levels at the lowest of the year outside of early Jan, we may see a very short term pullback early next week to test the simple triangle breakout at SPX 2700-10.

Bearish bond sentiment (TNX) has dropped over the last two weeks as rates consolidated just below the 3.0% levels as rates continue to track the 2 year notes since Oct 2017.

The gold miners (HUI) bearish sentiment remains elevated compared to the last year, but the 50% rise in rates (TNX) since late 2017 is providing strong headwinds to any advance.

II. Dumb Money/Smart Money Indicators
The Risk Aversion/Risk Preference Indicator (SPX 2x ETF sentiment/NDX ETF sentiment, outlook 2 to 4 days/hours) continues to be the best very ST indicator as the reversal of the modest SELLs of two weeks ago saw a strong move up prior to last weeks rally as posted on Twitter. Now at the end of last week we've seen sentiment pullback again, warning of a modest pullback over the next few days, possibly to test the simple triangle breakout.

I have revamped the Dumb Money/Smart Money Indicator as short/INT term (outlook 2 to 4 days/weeks) which showed the bottoming potential of the last two weeks, but dropped sharply last week and may be repeating the sequence leading up to the Jan top.

The INT term SPX Long Term/Short Term ETFs (outlook two to four months) saw a sharp drop last week when the SPX 2x ETF (dumb money) bearish sentiment fell sharply while the 3x ETF sentiment (smart money) remained unchanged. This looks a lot like the late July 2017 sentiment which consolidated for two/three weeks before the Aug pullback.

The INT term NDX Long Term/Short Term ETF Indicator (outlook two to four months) also fell but not as much as a couple of weeks ago before the sharp drop in the NDX, so more upside/consolidation is likely.

III. Technical Indicators/Other
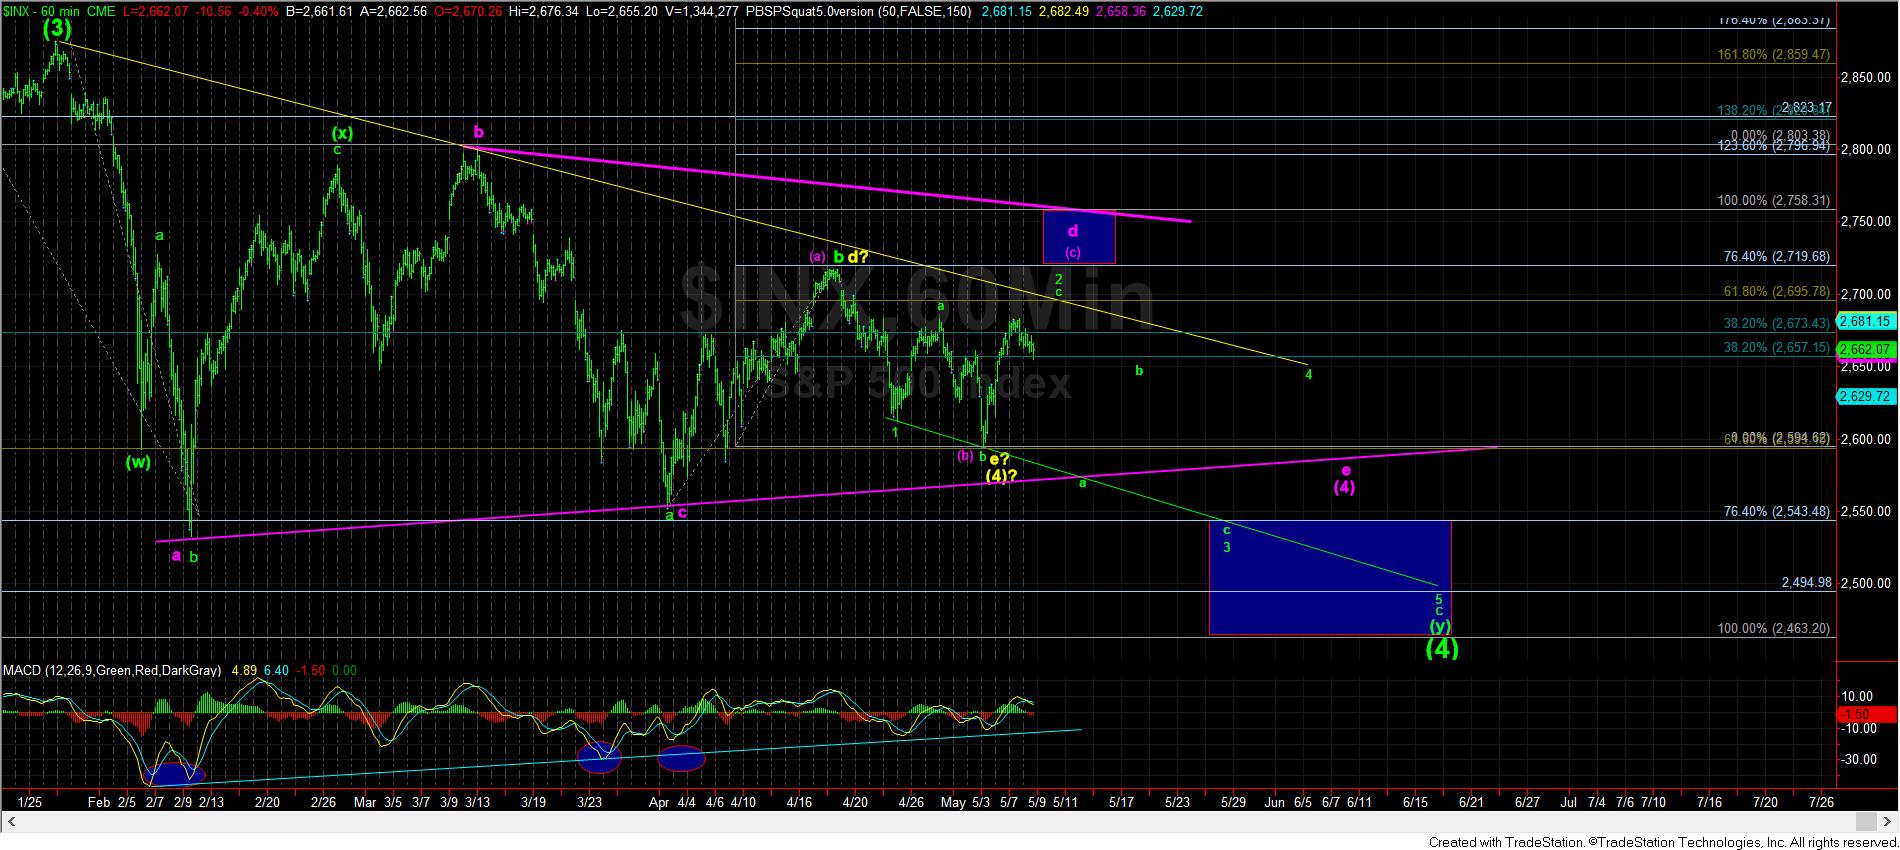
Just as a followup to the Bermuda triangle. Here the purple TL top is what the public is looking at while the red TL top is what the EW community is looking at.

IV. Options Open Interest
SPX options open interest was not very effective last week as I have noted that days where there is high OI tend to have a stronger influence similar to M/W/F two weeks ago where we had EOM/FOMC/NFP coinciding with high OI. The next sequence with high OI is May 25 (?), May 31 (EOM), and June 1 (NFP). Possibly we will have a May 25 top, drop into EOM then rally thru NFP.
For next week OI is light even this is optn exp week. Mon, since the SPX is at 2728 positive delta hedging could push prices as high as 2750, or if the 2710 calls act as resistance they may push prices down to 2700.

For Wed, the story is much the same where calls control the action between 2655 and 2750, and the effect of the 2700 calls are likely to determine whether prices are higher or lower.

For Fri PM, strong overhead resistance moves up to SPX 2780, but given other sentiment indicators and DM/SM Indicators, most of the week may be spent consolidating around the SPX 2700 area with a move to higher levels delayed to the next week after bearish sentiment has a chance to reset.

Conclusions. Instead of an early week rally to SPX 2700 followed by a pullback, the SPX pulled back to the 2650's Mon/Tue generating a positive outlook with the Risk Aversion Indicator as posted on Twitter, then rallied to breakout of the simple triangle that produced a sharp drop in bearish sentiment across the board. Another modest pullback to test the simple triangle breakout over the next few days may reset sentiment before the next rally toward the SPX 2740-60 level. Check for updates intra week on Twitter.
Weekly Trade Alert. None at this time. Updates @mrktsignals.
Investment Diary, Indicator Primer, update 2018.03.28 Dumb Money/Smart Money Indicators
Article Index 2018 by Topic
Article Index 2017 by Topic
Article Index 2016 by Topic
Long term forecasts
© 2018 SentimentSignals.blogspot.com
No comments:
Post a Comment