Saturday, May 25, 2019

The Empire Strikes Back

Last week started out rough with an SPX 50+ pt decline after China's Xi seemed to follow my advice and walk away from the trade talks with threats of retaliatory tariffs as well as telling the Chinese populace to stop using iPhones and eating at McDs and BKs.

The good news is that the SPX 2800 level held, but for how long?  There has been steady deterioration in the $SKEW (an indicator of complacency) that is reminiscent of late 2018 as well as 2007-08 (more in Tech/Other).

I. Sentiment Indicators

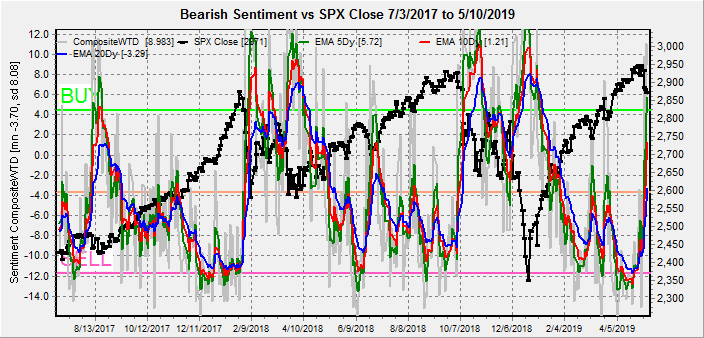
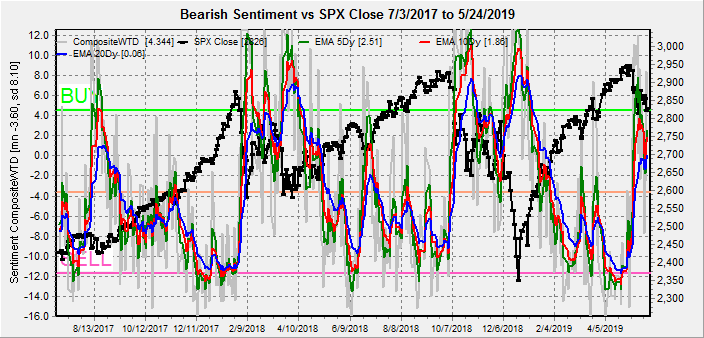
The overall Indicator Scoreboard (INT term, outlook two to four months) bearish sentiment decreased sharply, but no further lows are expected until a drop below neutral.


The INT view of the Short Term Indicator (VXX+VXXB $ volume and Smart Beta P/C, outlook two to four months) bearish sentiment has declined to below neutral, so more volatility is expected.


Bonds (TNX).  Interest rates continued to fall with fear of a trade war with China overshadowing low bearish sentiment.


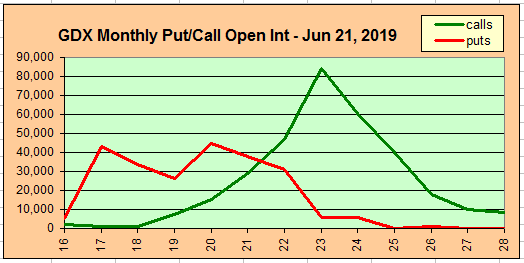
For the INT outlook with LT still negative, the gold miners (HUI) bearish sentiment is in a slow decline matching the price declines.  Some progress towards the GDX 21 level, as indicated by last weeks options OI, was seen, but could not hold.


II. Dumb Money/Smart Money Indicators

For this week and possibly for the next several months, I am going to replace the DM/SM ETF indicators with other indicators.

The option-based Dumb Money/Smart Money Indicator as short/INT term (outlook 2 to 4 mns/weeks) reached the level normally associated with a BUY, but does not seem to be having much of an effect in a "trade news" driven market.


The INT term SPX Short Term (3x/SM) ETFs (outlook two to four weeks) bearish sentiment may give some hope to the bulls short term as sentiment reached the levels of the Apr 2018 retest.


The INT term NDX Long Term (2x/DM) ETFs (outlook two to four weeks) bearish sentiment has also reached an extreme matching the Feb 2018 crash and Apr 2018 retest.  Together with the SPX ETF indicator some consolidation, or a possible move back toward SPX 2900 seems likely before any significant downside..


III. Options Open Interest

Using Thur close, remember that further out time frames are more likely to change over time, and that closing prices are more likely to be effected.  This week I will look out thru May 31. Also, This week includes a look at the TLT thru Jun.

With Fri close at SPX 2826, Mon & Wed are so light OI that effects may be minimal, but a move towards SPX 2850-60 is possible.


Wed SPX puts show very small support between 2840-75, while larger support is at 2800, and call resistance is minimal.


For Fri, with large OI, looks like a copy of last Fri, where a range of SPX 2825-75 is likely to contain prices and 2850 is most likely.


The TLT 20 year bond fund is used as a proxy for interest rates.  For the last several years  when the TNX was 112 when the TNX was 3.2% (11/2018), the TLT was 124  when the TNX was 2.5% (12/2017), and the TLT was 140 when the TNX was 1.5% (08/2016).

Currently the TLT is 127.8 with the TNX at 2.32%.  The puylook for TLT is little changed from two weeks ago, as strong put support at 120 and declining call resistance over 125.


IV. Technical / Other

A long term look at the $SKEW as a measure of complacency is again showing a disturbing trend that resembles the 2007-08 top.  The sharp decline from the Oct SPX highs was a warning, and this may indicate longer term troubles.


Although I still not in the "crash and burn" camp, sentiment behavior over the last week (pullback in bearishness) has me leaning more towards the stair step type of decline with an expected time frame of about a year.  This fits the topping pattern of a double top or giant "M" where the down leg is usually about half the time of the up leg.  The downside price target is the late 2016 level of SPX 2100-200.


Conclusions.  Overall this a news and not a sentiment driven market, specifically the ongoing verbal fisticuffs between the US and China.  In many ways, China is following the same path of military and economic expansion followed by Japan in the 1920s and 1930s which led to its dominance of the Far East including much of China.  Perhaps this is why appeasement is not acceptable to the US, in order to prevent a similar situation to WW2 in the Far East.  That being said, the stock market is likely to be fighting a war of attrition that is likely to go 10 to 12 rounds, rather than a 1 to 3 round knockout.

Weekly Trade Alert.  Options OI shows little gains are likely by the EOM, but high bearish sentiment may surprise with a move back to SPX 2900 in June before significant additional downside.  Updates @mrktsignals.

Investment DiaryIndicator Primer,  update 2019.04.27 Stock Buybacks, update 2018.03.28  Dumb Money/Smart Money Indicators
Article Index 2019 by Topic
Article Index 2018 by Topic
Article Index 2017 by Topic
Article Index 2016 by Topic
Long term forecasts

© 2019 SentimentSignals.blogspot.com

Saturday, May 18, 2019

Looking Backwards

One of the things I have noticed about the stock market over the years is that most investors look at the immediate past to project expectations for the future.  This, unfortunately, results in many being bullish at the top and bearish at the bottom.  Thus, the use of sentiment indicators to look at a variety of measures to avoid following the crowd.  As an example, in April 13's conclusions, I mentioned that a bearish blog I followed was talking about DJIA 30K, and today the same blog is looking for a repeat of 2018's Oct-Dec selloff to retest the lows by Aug.  Maybe this time will be different.

Sentiment this week is decidedly bearish, exceeded only by the Feb and Oct-Dec 2018 lows.  The large SPX 50-60 pt declines on Mon/Tue of last week have awakened the bears, but my feeling is that any follow thru to the downside is likely to be disappointing.  As shown in Tech/Other, the markets seem to be following the pattern off of the previous V-bottom of Oct 2014.


I. Sentiment Indicators

The overall Indicator Scoreboard (INT term, outlook two to four months) bearish sentiment has risen to levels exceeded only by Aug 2017, and Feb and Oct-Dec of 2018. Upside is probably limited, as is downside.


The INT view of the Short Term Indicator (VXX+VXXB $ volume and Smart Beta P/C, outlook two to four months) bearish sentiment has lagged other indicator due to low volatility hedging (shown below).


Taking a closer look at the VXX (ticker is now back from VXXB in Jan) shows extremely low readings, and even if prices do not move substantially lower, expect a continued high level of volatility.


Bonds (TNX).  Bearish sentiment remains extremely low, and compared to the levels of Dec and Oct 2018 is warning to sell bonds and buy stocks,.


For the INT outlook with LT still negative, the gold miners (HUI) bearish sentiment has retreated back below neutral as the recent surge in bearish sentiment did little to lift prices.


II. Dumb Money/Smart Money Indicators

For this week and possibly for the next several months, I am going to replace the DM/SM ETF indicators with other indicators.

The option-based Dumb Money/Smart Money Indicator as short/INT term (outlook 2 to 4 mns/weeks), as shown in the Twitter Update Wed AM before a SPX 75 pt rally, surged to levels matching the Feb 2018 lows and is likely to be supportive of prices at this level.


And the sister options Hedge Ratio sentiment is lagging behind, showing that hedging activity is still moderate, so that volatility is likely to remain.


The INT term SPX Long Term (2x/DM) ETFs (outlook two to four weeks) bearish sentiment rose moderatly last week, matching that of the Jul 2018 lows..


The INT term SPX Short Term (3x/SM) ETFs (outlook two to four weeks) bearish sentiment rose to levels almost matching that of the Apr 2018 retest.  Recently, the SM has been a Gartman look-a-like, having missed most of the rally, so short at your own risk.


The INT term NDX Long Term (2x/DM) ETFs (outlook two to four weeks) bearish sentiment also rose sharply, matching the levels of the Apr 2018 retest, and is consistent with a 10% rally in the NDX.


III. Options Open Interest

Using Wed close, remember that further out time frames are more likely to change over time, and that closing prices are more likely to be effected.  The late Fri selloff probably increased put support at 2850.  This week I will look out thru May 22. Also, This week includes a look at the TLT for Jun 21.

With Fri close at SPX 2860. Mon with light OI show support at 2860, but large calls at 2850 may pull prices down intra-day.


Wed shows strong call resistance at SPX 2875, so a range of 2850-75 is likely.


For Fri, a range of SPX 2825-75 looks likely, but prior volatility will probably increase put support.


The GDX options open int for June 21, shows no love for GDX on the horizon, as strong call resistance at 22-3 is likely to hold prices at or below 21.


Currently the TLT is 126 with the TNX at 2.39%.  Last weeks TLT options open int show strong put support at 123 and below with call resistance decreasing over 124.  The Jun 21 monthly is much the same with very strong put support at 120 decreasing up to 123 with moderate call resistance over 124.  123 to 126 is likely. (no chart)


IV. Technical / Other

Last weeks decline exceeded my downside target with Trump's surprise announcement of plans to implement the 25% tariffs on $200 billion additional goods.  The timing was more of a surprise than the outcome, as this was expected later in the summer.  The interesting result was that the 5% decline was a match to the Dec 2014 selloff after the Oct V-bottom rally.  Volatility is likely to continue, but with most expecting a repeat ot the Oct-Dec 2018 decline followed by a pre-election rally in 2020, don't be surprised if we follow the pattern of 2015.


Conclusions.  If sentiment were supportive, I would love to join the crowd calling for a crash into Aug, likely to be followed by a pre-election rally into mid-2020.  However, to follow sentiment you have to learn to play chess while everyone else is playing checkers.  Sentiment is now the opposite of what it was in Oct-Dec 2018 when everyone thought the market could not go down due to positive seasonality, so sentiment-wise the SPX should hold the 2800-3000 level thru late 2019 with a couple of sharp selloffs in 2020 similar to the last half of 2915 and early 2016.

Weekly Trade Alert.  Choppy trading is likely for the next couple of months similar to Jan-Feb 2015 with a retest of the SPX 2800 before the bulls can gain any traction.  Updates @mrktsignals.

Investment DiaryIndicator Primer,  update 2019.04.27 Stock Buybacks, update 2018.03.28  Dumb Money/Smart Money Indicators
Article Index 2019 by Topic
Article Index 2018 by Topic
Article Index 2017 by Topic
Article Index 2016 by Topic
Long term forecasts

© 2019 SentimentSignals.blogspot.com

Saturday, May 11, 2019

Poking the Bear

Very early in the development of the trade war between the US and China, I expressed reservations about an easy "victory" for the US due to the 200 year history of trade conflicts between China and the West dating back to the Opium Wars of the mid 1800s.  Since then on numerous occasions I warned that Trump was likely to lose his patience, like a petulant child, and ramp up the tariff levels to 25% and last week saw that happen.

The more I think about it, I see Trump as the modern day version of Marlon Brando's Ugly American where showing a little respect would be a lot more productive than unlimited arrogance.  If China has any sense, they should just walk away and let the US markets crash, but it would probably be a good idea to stretch it out to the 2020 elections to make sure Trump is booted out.

I have a few extra charts this week in the Tech/Other section, so I am going to do minimal discussion and let the charts do the talking.

I. Sentiment Indicators

The overall Indicator Scoreboard (INT term, outlook two to four months) bearish sentiment.
increased sharply last week that may support a ST rally, but longer EMAs do not show INT support.


The INT view of the Short Term Indicator (VXX+VXXB $ volume and Smart Beta P/C, outlook two to four months) bearish sentiment rose moderately indicating that volatility is not likely to go away any time soon.


Bonds (TNX).  Interest rates saw a mild pullback, but there was little change in sentiment.


For the INT outlook with LT still negative, the gold miners (HUI) LT bearish sentiment seems to finally catching up with the miners as prices bounced briefly to start the week then continued to fall.  Bearish sentiment fell as well.


II. Dumb Money/Smart Money Indicators

For this week and possibly for the next several months, I am going to replace the DM/SM ETF indicators with other indicators.

The option-based Dumb Money/Smart Money Indicator as short/INT term (outlook 2 to 4 mns/weeks) rose sharply, matching the Jul 2018 lows.  A rally for optn exp week seems likely.


And the sister options Hedge Ratio sentiment has lagged behind indicating that a rally at this point is likely to be short lived..


The INT term SPX Long Term (2x/DM) ETFs (outlook two to four weeks) bearish sentiment has risen only modestly and is short of the Jul 2018 levels.


The INT term NDX Long Term (2x/DM) ETFs (outlook two to four weeks) bearish sentiment has risen above the levels of Jul 2018, so the NDX should outperform.


III. Options Open Interest

Using Wed close, remember that further out time frames are more likely to change over time, and that closing prices are more likely to be effected.  This week I will look out thru May 17.

With Fri close at SPX 2881.  Light int overall with put support at 2875 and call resistance at 2915.  Weakness to start the day is possible to 2850, but a close at/over 2875 is likely.


Wed shows very little bias between 2875 and 2925 but will likely change during the week.


For Fri, optn exp with large open int shows put support up to 2900 with call resistance at 2925.  A move to 2920 is possible as shown in the Tech/Other section.


This week I am going to look at both TLT and GDX for Jun 21.  Using the GDX as a gold miner proxy.  For Jun optn exp, currently at 20.3, the Jun target is 20-21.


The TLT 20 year bond fund is used as a proxy for interest rates.  For the last several years  when the TNX was 112 when the TNX was 3.2% (11/2018), the TLT was 124  when the TNX was 2.5% (12/2017), and the TLT was 140 when the TNX was 1.5% (08/2016).

Currently the TLT is 124.7 with the TNX at 2.55%.  Last weeks update predicted a weekly close of 124+, and the high for the week was 125.  For Jun 21, put support should keep prices near 123.


IV. Technical / Other

During the course of setting up the "new" VIX Call indicator a few weeks ago, I set up an export of my DB to a CSV format for import into Excel, so now I can "data mine" the entire DB.  This week I will show puts and calls for the VIX and SPX.

VIX calls (smart money) saw a sharp increase over 50% of the mean similar to Nov 2017 and Aug 2018, where both were followed to rally tops 2 months later.


While VIX puts (dumb money) rose even sharper, up over 78% of the mean, and in between the Jun and Oct selloff lows.


SPX calls have remained very subdued, supporting the low bullish interest shown in last weeks Rydex bull fund.  Notice the run ups prior to the 2018 Jan, Mar and Sept tops


While SPX puts saw a sharp rise in a down market as seen in Mar and Oct 2018.


Additionally for EW counters, the SPX decline so far looks like an expanding diagonal with 3 waves so far that may rally back to the low 2900s next week in agreement with the options OI.  The hourly MACDs are extremely oversold.


Conclusions.  Overall sentiment supports a ST rally back to the SPX 2900s, but not likely a LT bottom.  China trade talks are likely to dominate the markets over the next few weeks.  A new high at SPX 3000+ is possible with positive trade results, but I rate this at 40% and it would be a "sell the news" rally.  A couple of years ago I did a sentiment analysis of the 2007-09 period and found that bearish sentiment was lowest in May 2018 after a partial retrace of the Lehman selloff.  We could see something similar with stalled trade talks leading to a stair step decline into the Fall to SPX 2400-500.  At that point the Fed may try QE-lite as discussed last week by buying 1-2 yr T-bonds that then leads to a rally back to SPX 2850+.  If sentiment becomes bullish enough, a decline into the election is possible if worries over a Trump re-election surface.

Weekly Trade Alert.  Mon may start the week weak to SPX 2850-75, but an opt exp week rally to about 2920 is likely.  Updates @mrktsignals.

Investment DiaryIndicator Primer,  update 2019.04.27 Stock Buybacks, update 2018.03.28  Dumb Money/Smart Money Indicators
Article Index 2019 by Topic
Article Index 2018 by Topic
Article Index 2017 by Topic
Article Index 2016 by Topic
Long term forecasts

© 2019 SentimentSignals.blogspot.com

Saturday, May 4, 2019

Minor Correction in Progress

Some type of correction was expected into mid May and last week may be a preview.  There may be a pickup in volatility but within a 2-3% range.  Last week started a SPX 2940, rallied to 2954 then dropped to 2900 Wed/Thur before rallying back to close at 2946.

The SPX options OI provided several inflection pts posted on Twitter as Tue pullback was indicated to find support at 2925 (2924 act) then rallied into Wed FOMC with resistance at 2950 (2054 act), where potential was indicated first to 2920-30 (2923) then 2900-20 (2900.5).  Next week shows an early week range of 2930-50, while a late week pullback to 2900-25 is indicated.  Interestingly, now both XI and Trump are talking about walking away, so next weeks trade talks may end up as a disappointment.


I. Sentiment Indicators

The overall Indicator Scoreboard (INT term, outlook two to four months) bearish sentiment increased modestly, but not enough support a rally, except for a Jan 2018 type blowoff.


The INT view of the Short Term Indicator (VXX+VXXB $ volume and Smart Beta P/C, outlook two to four months) bearish sentiment remains very low and the declining bottoms (from Jan and Oct) may be pointing to a larger degree correction after a top is in.


Bonds (TNX) bearish sentiment has declined even as rates moved higher much like it did in Sep 2017.


For the INT outlook with LT still negative, the gold miners (HUI) bearish sentiment H&S pattern does seem to be playing out as the drop to the bottom of the larger left shoulder is at 150.  Options OI does support a rally into June (160 possible).


II. Dumb Money/Smart Money Indicators

For this week and possibly for the next several months, I am going to replace the DM/SM ETF indicators with other indicators.

The option-based Dumb Money/Smart Money Indicator as short/INT term (outlook 2 to 4 mns/weeks) sentiment saw a decent bounce that may be like Dec 2017, but not enough to normally support a rally.


And the sister options Hedge Ratio sentiment is pretty much the same.

The INT term SPX Long Term (2x/DM) ETFs (outlook two to four weeks) bearish sentiment remains very low.


While the INT term SPX Long Term (3x/SM) ETFs bearish sentiment did increase more.


The INT term NDX Long Term (2x/DM) ETFs (outlook two to four weeks) bearish sentiment is weak but not extreme.


III. Options Open Interest

Using Wed close, remember that further out time frames are more likely to change over time, and that closing prices are more likely to be effected.  This week I will look out thru May 10. Also, This week includes a look at the TLT for May.

With Fri close at SPX put support at 2930 and call resistance at 2950 should limit moves to this range.


Wed similar to Mon with a slightly stronger upward bias.


For Fri with large open int, everyone seems to be betting on positive outcome for the China trade talks, but a move down toward the 2900 level looks likely.


Using the GDX as a gold miner proxy.  For May exp (no charts) showed weak put support at 21 with a close at 20.3.  Jun does show increased put support up to 22.

The TLT 20 year bond fund is used as a proxy for interest rates.  For the last several years  when the TNX was 112 when the TNX was 3.2% (11/2018), the TLT was 124  when the TNX was 2.5% (12/2017), and the TLT was 140 when the TNX was 1.5% (08/2016).

Currently the TLT is 123.7 with the TNX at 2.53%.  The Twitter update was looking for a drop to 123 which was seen on Mon and Thur, before moving higher.  For May 17, put support should lift prices to 124+.


IV. Technical / Other

For those that like daily updates, I found some old links for Rydex Bear & Bull Funds that update on Stockcharts.com.  This chart was pretty useless for about 10 years after 2008 because the bear fund lost most of its assets to competitors (vol prod, etc) , but the last two years did pretty good at the Jan and Oct 2918 tops.  Note the SELL line is at 3.75% Bear/Bull.  Due to the small bear fund size this may be unreliable.  Comparing this to the SPX ETFs using avg daily $ volume for 2019 shows SDS/SSO as $182m/$172m, and SPXU/UPRO 165m/230m.


Probably more important, looking at the Rydex Bull only, is the fact that the level of bullishness is significantly below where it was at the two 2018 tops.  Hence an immediate top is not expected.


Conclusions.  Bearish sentiment has only increased modestly, so the overall outlook for a rounded top with a minor correction of 2-3% is still valid.  China trade talks seem to be at an impasse, but both sides may be trying to call the others bluff.  This was a really poorly designed strategy by POTUS since there is almost no recourse to verify or enforce the actions of the other party.  Other than setting up an exchange of "trade police", the WTO was probably the best solution, but the US has withdrawn.  A complete failure by late summer as suggested last Sept is looking more likely

Weekly Trade Alert.  Friday's rally may setup a distribution pattern that will eventually take the SPX below 2900 if disappointment is seen by the EOW with the China trade talks.  Updates @mrktsignals.

Investment DiaryIndicator Primer,  update 2019.04.27 Stock Buybacks, update 2018.03.28  Dumb Money/Smart Money Indicators
Article Index 2019 by Topic
Article Index 2018 by Topic
Article Index 2017 by Topic
Article Index 2016 by Topic
Long term forecasts

© 2019 SentimentSignals.blogspot.com