
Last week was expected to see a mild pullback of 1-2% before a rally to test the ATH by Wed Apr 28 (FOMC), and by Tue mid-day, the SPX bottomed at 4118 (down 1.5%) and actually made a new ATH Fri. Options OI is now indicating a possible FOMC high near SPX 4225 before a decline down to/below 4100 possible by Fri. This is also very similar to Trader Joes B Wave outlook.
The market seemed surprised Thur when Biden announced raising the capital gains tax rate on high income investors, but then reversed Fri as many concluded that resistance in Congress would only result in a rollback of Trump's tax cuts. The more important factor may be that without higher taxes, deficit spending will pressure int rates higher which may be even more negative for stocks. Otherwise, last weeks volatility saw little change in sentiment other than a sharp increase in VXX $ Vol which indicates that the next pullback should be BTFD. The recent pickup in volatility has increased put buying that is likely to delay by several weeks any significant pullback.
The Tech/Other section covers similar patterns to the May 2015 top, while the data mining put-call indicators show that more time is likely before a top. The Twitter update Tue AM saw a drop in the LT NYUPV/NYDNV to the sell level but the late reversal and subsequent rally reversed the signal.
I. Sentiment Indicators
The overall Indicator Scoreboard (INT term, outlook two to four months) bearish sentiment was little changed for the week as stocks fell early in the week then rallied back strongly.
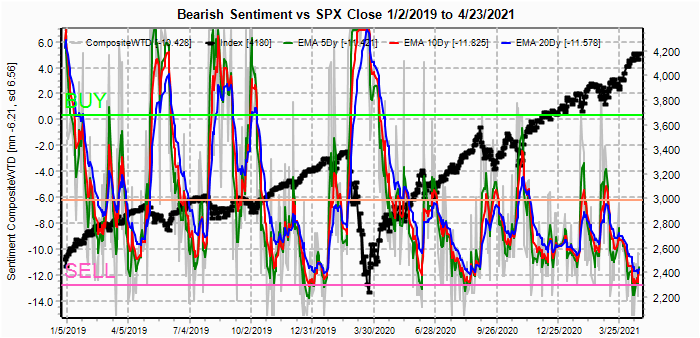
The INT view of the Short Term Indicator (VXX $ volume and Smart Beta P/C [ETF Puts/Equity Calls], outlook two to four months) bearish sentiment has rallied more strongly (due to VXX $ Vol below) and may be following the Jan-Feb 2020 analog.

The VXX $ Vol rose sharply, with a pickup in sharp day-to-day volatility that is sometimes indicative of a topping formation.

Bonds (TNX). Bearish sentiment in bonds saw a fairly sharp drop in bearish sentiment last week with only a small drop rates, possibly as a safe haven with the pickup in stock volatility, but likely indicative of higher rates in the future.

For the INT outlook with LT still negative, the gold miners (HUI) bearish sentiment is presented in a new format using the data mining software to add the inverse TNX rate to the ETF ratio. Prices rallied last week as expected with the pickup in bearish sentiment, but sentiment fell even more sharply, now indicating that a resumption of the decline is not far away.

II. Dumb Money/Smart Money Indicators
The option-based Dumb Money/Smart Money Indicator as short/INT term (outlook 2 to 4 mns/weeks) bearish sentiment rose slightly last week.

And the sister options Hedge Ratio bearish sentiment rose by about the same amount.

The recent rise to ATHs in the NDX has now almost completely reversed the high bearish sentiment seen after the Jan decline and will likely limit further gains.

III. Options Open Interest
Using Thur closing OI, remember that further out time frames are more likely to change over time, and that closing prices are more likely to be effected. Delta hedging may occur as reinforcement, negative when put support is broken or positive when call resistance is exceeded. This week I will look out thru Apr 30. Also, no charts for GDX or TLT.
With Fri close at SPX 4180, options OI for Mon moderate call OI may pressure prices down toward 4150 with significant put support there.

Wed has small OI where SPX has moderate put support at 4100 and call resistance at 4200 and more strongly at 4225 with little in between and that could contribute to wide price swings. SPX 4225 is possible around FOMC conclusion, but could see a sharp reversal.
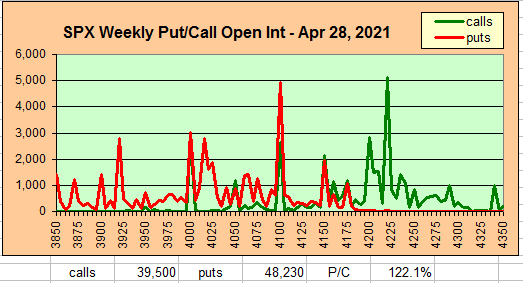
For Fri, SPX has stronger call resistance that could see a drop down to put support at 4075-85.

IV. Technical / Other
Over the past year, I've referred to the rounded top of May 2015 following the avian flu scare of Oct 2014 as a possible analog. The recent daily price swings is reminiscent of the 3 mont price period around the May top where prices remained in about a 3-4% price range. Is it a coincidence that prices are now almost an exact double of 2015?

Looking at the Composite Put-Call indicator, we may have seen the lows in Jan and Feb similar to early 2020, and in looking at the data from 2015, bearish sentiment bottomed several months before the top, moving to near neutral by May.

As I pointed out earlier, even though Equity Put-Call indicators were extremely low over the last year, SPX Put-Call indicators were very high and a INT drop may not occur until lower bearish readings are seen.

Conclusions. The day-to-day volatility of the stock market has somewhat muddied the ST outlook as the increase in put OI and volatility hedging with VXX may delay a decline of more that 3-4% for several weeks. Comparisons to the rounded top of 2015 showed that this type of ST volatility may go on for several months before an INT direction is made clear. As long as int rates (TNX) remain in consolidation between 1.5-1.75% there will remain modest support for stocks, but sentiment for TNX and HUI indicate that upward pressure on rates is not far off. SPX options activity is also increasing which us usually a sign of an approaching top, but may not reach a critical level for several months.
Weekly Trade Alert. Things seem to be progressing mostly as outlined last week, but at more frantic pace than expected. Next week may see another early pullback to SPX 4150-75, but a move over 4200 (possibly 4225) for FOMC Wed looks likely with the OI data. A sudden reversal is possible to 4100 or lower by EOW or early May. Updates @mrktsignals.
Investment Diary, Indicator Primer,
update 2020.02.07 Data Mining Indicators,
update 2019.04.27 Stock Buybacks,
update 2018.03.28 Dumb Money/Smart Money Indicators
Article Index 2019 by Topic, completed thru EOY 2020.02.04
Article Index 2018 by Topic
Article Index 2017 by Topic
Article Index 2016 by Topic
Long term forecasts
© 2021 SentimentSignals.blogspot.com


