
The biggest news for the week was that the Mueller investigation report did not implicate Trump of any wrong doing. This was probably his biggest hurdle for reelection in 2020 and now I see his chances of reelection at 60%+. This must have China worried since they undoubtedly were hoping to wait out the remainder of Trump's term to get a more receptive President and therefore increases the chances of some type of trade agreement before the election.
A second news item that may have long term implications regarding the markets is the nomination of Steve Moore to the Fed's board of governors. If appointed, he would be a shoo-in to be the next Fed chairman since he "talks the Trump talk", including recently calling for immediate int rate cuts. This could be a setup for four years of "crazynomics" last seen when Arthur Burns was chair in the pro-growth 1970s. We may finally see the "blowoff top" as predicted in my long term forecast of 2015 where I said the DJIA could reach 27,000 based low int rates and that a return to growth could mean 36,000 or higher.
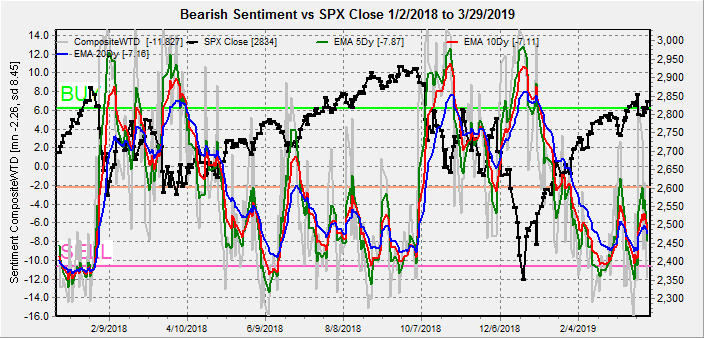
I. Sentiment Indicators
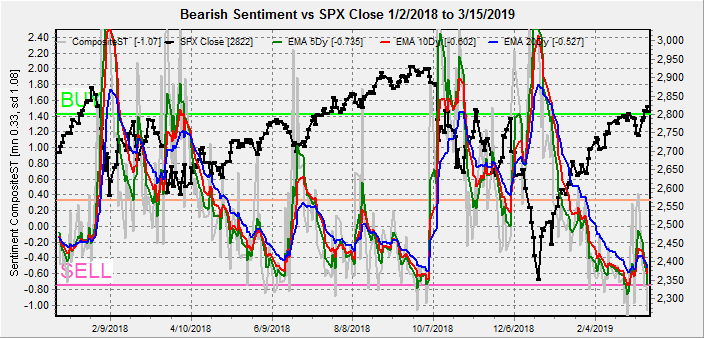
The overall Indicator Scoreboard (INT term, outlook two to four months) bearish sentiment spiked higher on the sharp intraday pullback to SPX 2775 on Mon and has since reversed and could be setting up for a pre exp week pullback the 2nd week of Apr. The overall pattern resembles Aug-Oct 2018.
The INT view of the Short Term Indicator (VXX+VXXB $ volume and Smart Beta P/C, outlook two to four months) bearish sentiment has only started to reverse its recent spike, so an immediate pullback is not expected.

Bond sentiment (TNX) remains near neutral as recession fears based on the yield curve inversion caused am almost parabolic spike in bonds, but the TLT options outlook last week indicated this may be short lived and is near a peak with the TLT over strong call resistance at 125.

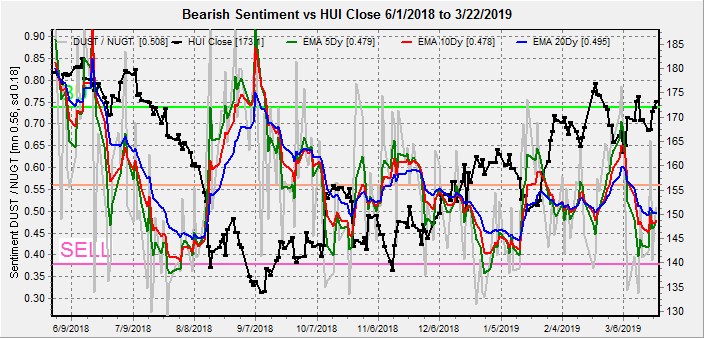
For the INT outlook with LT still negative, the gold miners (HUI) bearish sentiment has risen slightly.

And for the ST, the H&S no longer looks viable as the sharp drop in rates fueled demand for PM stocks.

II. Dumb Money/Smart Money Indicators
The Risk Aversion/Risk Preference Indicator (SPX 2x ETF sentiment/NDX ETF sentiment, outlook 2 to 4 days/wks) as a INT indicator shows little change.

The option-based Dumb Money/Smart Money Indicator as short/INT term (outlook 2 to 4 days/weeks) remains in a fairly tight range.

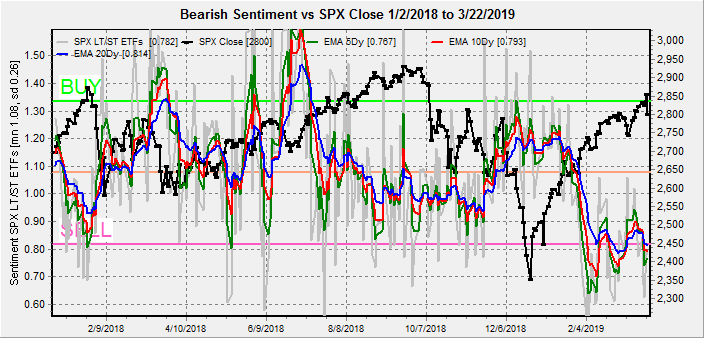
The INT term SPX Long Term/Short Term ETFs (outlook two to four weeks) bearish sentiment is also relatively unchanged.

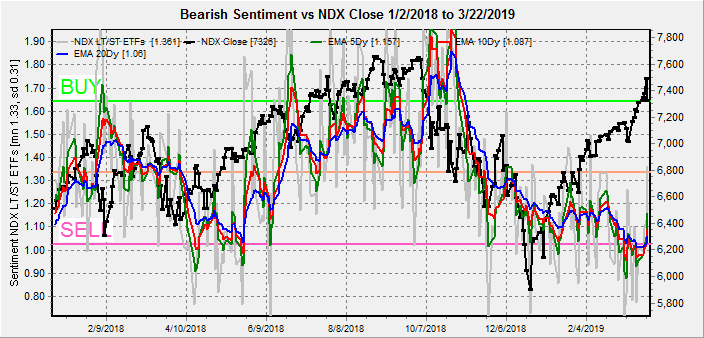
Long term neutral, the INT term NDX Long Term/Short Term ETF Indicator (outlook two to four weeks) continues to show that short term money is avoiding the tech sector.

III. Options Open Interest
Using Thurs close, remember that further out time frames are more likely to change over time, , and that closing prices are more likely to be effected. This week I will look out thru Apr 5. Also, I will try to continue alternating weeks with a special look at the GDX and TLT.
With Fri close at SPX 2834, the Fri options OI showed what happened for most of the week as smaller put support was able to overwhelm stronger call resistance due to overall sentiment.

Mon. Light open int overall. As long as prices remain over SPX 2825 hedging could push prices higher to 2850, but a move below 2825 could fall to 2800.

Wed show modest put support at SPX 2790 and may hold in the 2825-40 area.

Fri, jobs report, shows that a push toward SPX 2800 is likely with large open int. As seen last week volatility early in the week will likely increase put support.

Using the GDX as a gold miner proxy. For Apr exp, a large increase in put support between 21 and 22 is likely to keep GDX from falling much below 22. This somewhat lines up with TLT where int rates are expected to be soft thru mid Apr then rise into the summer,

IV. Technical / Other
One of the technical indicators I like to keep tabs on is the High Risk Indicator or $NYAD/$NYUD. This measures the net adv issues to net adv volume. Originally, I thought that a high ratio measured more risk but looking at the performance overall, a decline to 1.0 has more often pointed to a top while a move to 4.5 has been a top or bottom. The current value at 1.83 is declining but not at a warning level yet.

The Hedge Ratio was one of the better indicators for 2015 and last week declined sharply, now approaching the level where an SPX 95 pt pullback was seen early Mar.
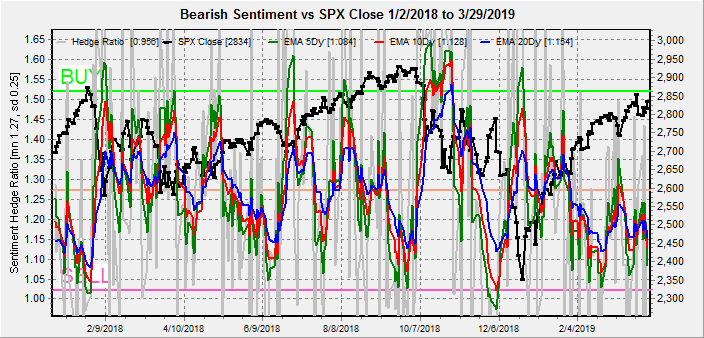
Comparing the current period to 2015, we did not get the expreme lows seen in Dec 2015 that may explain why there was no 38% retracement as most were expecting and we seemed to be repeating the levels seen between Jan-May 2015 where shallow but more frequent pullbacks were seen.

Reviewing the 2015 period, there are similarities between now and both early and late 2015. First, early 2015 was a V-bottom rally, but the failure to see a 38% retrace may bring the longetivity of the rally into question. Second late 2015 saw essentially a straight line rally to a longer term top, and also started with a 10 to 1 Zweig breadth thrust much like this rally. The breadth thrust had many convinced that the Nov-Dec consolidation was a wave 4, with Q1 2016 projections of SPX up 300 pts, but instead Jan saw a 300 pt decline. Also note the "golden cross" about 3 weeks before the bottom fell out.

Conclusions. Overall sentiment has pulled back from the modest positive outlook early in the week, but does not show the risk of an imminent pullback. A consolidation in the SPX 2825-50 area early in the week may be enough to shift sentiment downward to support an 80-100 pt pullback starting late in the week, but an early test of 2800 (China trade talk disappointment?) will probably increase support later in the week.
Weekly Trade Alert. Depending how the week starts, there will likely be a reversal by EOW. Possible down-up-down. Updates @mrktsignals.
Investment Diary, Indicator Primer, update 2018.03.28 Dumb Money/Smart Money Indicators
Article Index 2019 by Topic
Article Index 2018 by Topic
Article Index 2017 by Topic
Article Index 2016 by Topic
Long term forecasts
© 2019 SentimentSignals.blogspot.com


