
The SPX options OI, that has worked well the past three weeks and warned of a downturn last week, is now showing the potential for a consolidation around the 2750 area (2725-75) thru the EOM. This may simply be a resting place until some news event, Mueller, Brexit or China trade, pushes the SPX 100 pts either way.
I. Sentiment Indicators
The overall Indicator Scoreboard (INT term, outlook two to four months) bearish sentiment ST EMAs have barely reached neutral. Too early for a lasting bottom.

The INT view of the Short Term Indicator (VXX+VXXB $ volume and Smart Beta P/C, outlook two to four months) bearish sentiment has barely moved from the SELL level. Should at least reach the June 2018 price lows level before more than a bounce.

Bond sentiment (TNX) is still looking like the Jun-Sep 2018 period where a three month consolidation was seen before a sharp runup in rates. Six months ago, I predicted that the Fed funds rate and TNX would meet at 2.5% the 1st half of 2019 as the economy slows. The prior weeks rise may have been a fake out.

For the INT outlook with LT still negative, the gold miners (HUI) bearish sentiment rose on the early weeks pullback.

ST the HUI has reached the 170 level and may be creating a H&S top.

II. Dumb Money/Smart Money Indicators
The Risk Aversion/Risk Preference Indicator (SPX 2x ETF sentiment/NDX ETF sentiment, outlook 2 to 4 mns/wks) as a INT indicator has improved somewhat with the recent weakness in NDX, but is a long way from a BUY.

The option-based Dumb Money/Smart Money Indicator as short/INT term (outlook 2 to 4 mns/weeks) remains near neutral, but may be a warning as the "smart money" equity p/c is rising persistently, now at 0.75. Early Dec, I warned that this trend, seen in Sep-Oct 2018, was also seen before the Aug 2015 flash crash with equity p/c at 0.80+.

The sister Hedge Ratio does show rising bearish hedges, but should reach the levels of the Jun 2018 SPX lows before a bottom.

The INT term SPX Long Term/Short Term ETFs (outlook two to four weeks) bearish sentiment remains near neutral as there was a pickup in "dumb money" (2x) selling, while "smart money" (3x) remained neutral.

Long term neutral, the INT term NDX Long Term/Short Term ETF Indicator (outlook two to four weeks) saw a spike lower in sentiment before the selloff with strong "dumb money" buying. Note the similarity to May 2018 right before a sharp pullback in the NDX.

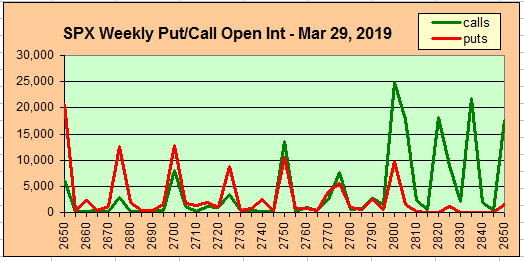
III. Options Open Interest
Using Thurs close, remember that further out time frames are more likely to change over time, and that expiration closing prices are more likely to be effected as Friday spent most of the day well below the SPX 2750 support as posted Thur (Twitter) but closed near it. This week I will look out thru Mar 29 EOM.
With Fri close at SPX 2743, Mon. Put support could push SPX towards 2770 with call resistance at 2780. Light open int overall.

Wed shows strong put support at SPX 2750, and prices could fall back to the 2755-60 level. Not a lot of call resistance to 2825 if the market wants to rally.

Fri, optn exp, AM, positions are mostly hedged. but the 10k unhedged calls should keep prices below SPX 2775 and will likely influence early weeks trading.

PM, similar to the AM where SPX 2775-80 should be firm call resistance with moderate put support at 2725 and 2750. Most likely close 2760-70.

Wed 20th, FOMC, is the most bullish. While the current week is likely to trade between SPX 2750-75, FOMC Wed put support should push prices over 2775 with little resistance to 2800. We could see a reverse of last Fri, where prices push over 2800 Tue/early Wed then reverse into Wed close. Upside target SPX 2805-15.

Fri 29th, EOM, similar to the current week where there is firm call resistance at SPX 2800 and little net put support until 2675 and 2725. Prices are likely to range between 2725 and 2775 but could push lower. Possible Brexit jitters?
IV. Technical / Other
Technical Indicator Composite, NYMO+TRIN+NYAD+NYUD, sentiment has risen from the extreme overbought levels that warned of a V-bottom similar to the Oct-Dec 2014 rally and have now risen to neutral. This is consistent with Nov-Dec 2014 prior to 38%+ retrace.

2014, sentiment near neutral with double top Nov-Dec.

Conclusions. Last week, several analysts were warning "beware the Ides of March", but SPX options open int warned that selling could start earlier and the result was a nearly 100 pt drop from the target high of 2815-25. With "dumb money" preparing for the apocalypse EOW as seen by Fri spike in VIX call buying at the lows, options OI is now warning of a mild consolidation week before another possible test of SPX 2800 the following week and then the apocalypse. Reminiscent of Oct-Nov 2018s three tests of 2800?
Weekly Trade Alert. Current outlook for next week is up-down-up roughly in an SPX 2750-75 range. More fun is likely later in month with potential for SPX 2800+ (2805-15) FOMC Mar 19-20 then down to test recent lows or lower by EOM. Will try to update FOMC charts later in week. Updates @mrktsignals.
Investment Diary, Indicator Primer, update 2018.03.28 Dumb Money/Smart Money Indicators
Article Index 2019 by Topic
Article Index 2018 by Topic
Article Index 2017 by Topic
Article Index 2016 by Topic
Long term forecasts
© 2019 SentimentSignals.blogspot.com
No comments:
Post a Comment