Saturday, October 27, 2018

Buyers on Strike

The good news is that Friday's selloff to SPX 2628 may have marked a low looking at previous mid-term election selloffs since the 2009 lows.  For both 2010 and 2014, the SPX corrected down to the 400 SMA following a previous strong years rally to an ATH.  The bad news is that longer term indicators are not at a point that indicate a strong rally any time soon.  The most likely outcome is a consolidation for several months between the 100 and 400 SMAs, roughly 2820 and 2635, which was the outcome in 2010.

The obvious wildcard is whether Trump has changed his mind that trade wars are easy to win and election losses may also increase pressure to reduce his hard line stance.  So far the loss for US equities using the Russell 3000 is 10% or about $3 trillion, while for China the loss is 20% on a market cap of about 7.5T or about $1.5 trillion (correction, China's SSEC down 32% or over $2.5T).  With the US GDP at $19T compared to China's 12T, the losses are not as bad compared to GDP, but still worse than China.

The focus is somewhat different this week, looking at longer term sentiment for stocks back to mid 2014.  I have also incorporated a long needed adjustment to Std Dec calcs where a 2x period adjustment changes Std Dev by 1/√2.  The Dumb Money/Smart Money includes an expanded view for the SPX, while the technical indicator section includes an expanded view of the four year cycle since 2009.  Options open int are omitted.  The conclusion is also expanded to look at several alternatives.

I. Sentiment Indicators

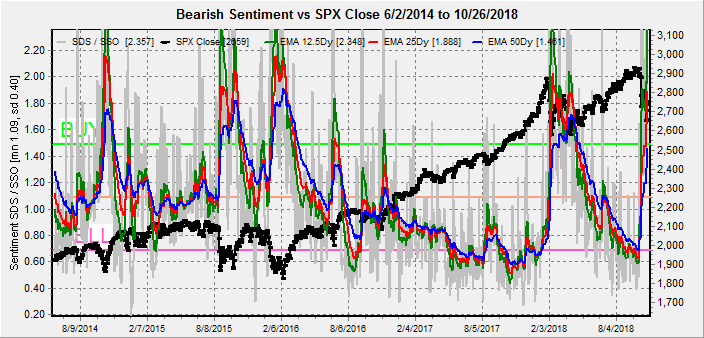
The overall Indicator Scoreboard (LT 2014.06 to present, 2.5x EMAs) bearish sentiment is on par with the Feb 2018 decline but not at levels that marked major bottoms of the past four years.  More volatility or retest aka Mar-Apr 2018 likely.


The LT view of the Short Term Indicator (VXX $ volume and Smart Beta P/C, outlook two to four months) bearish sentiment is about the same as Aug 2017, but less than Oct 2014.  More volatility likely to reach Feb-Apr levels.


Bond sentiment (TNX) using INT view, the strong BUY resulted in a modest retreat in rates, but with sentiment dropping sharply, rates may not drop below 3%..


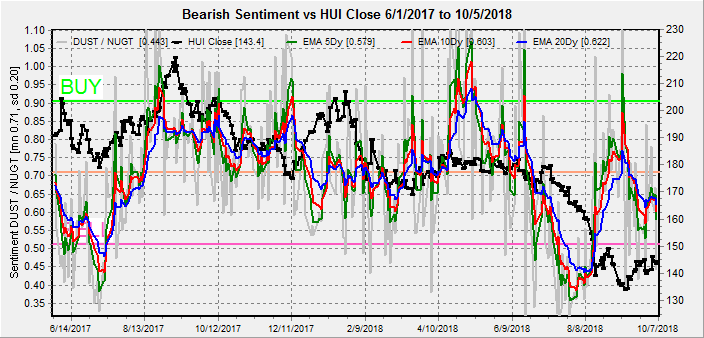
For the INT outlook with LT still negative, the gold miners (HUI) bearish sentiment fell as prices consolidated for most of the week, but then the HUI fell sharply Friday with weak EPS reports causing a slight uptick in bearish sentiment.


II. Dumb Money/Smart Money Indicators

The SPX Long Term/Short Term ETFs  (LT 2014.06 to present, 2.5x EMAs) bearish sentiment has continued to be an enigma, although following the Feb 2018 decline  bearish sentiment (2x vs 3x) did not pick up until the Mar-Apr retest (immediately prior to the sustained rally).


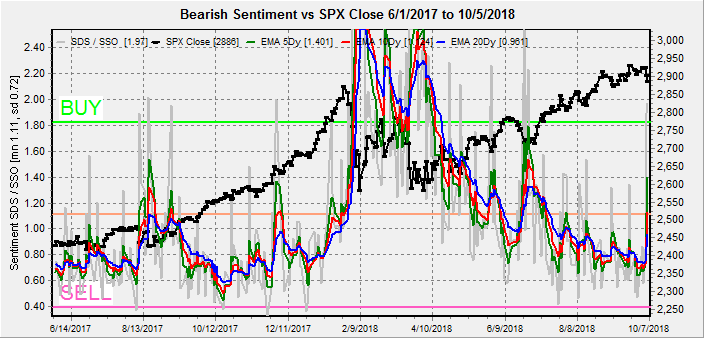
A closer look at the SPX ETFs may clarify.  First the 2x (SDS/SSO) ETFs, where we see that bearish sentiment has risen to just below the levels of the Feb 2018 pullback with the LT EMAs peaking right at the Mar-Apr retest lows.


For the SPX 3x ETFs (SPXU/UPRO) bearish sentiment accekerated more quickly and has already reached the levels of the Feb lows.  So the smart money (3x) seem to be more proactive, while the dumb money (2x) is reactive.


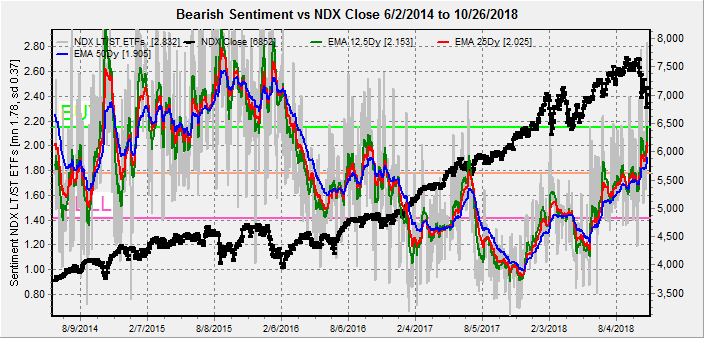
Long term neutral, the LT term NDX Long Term/Short Term ETF Indicator has improved, especially compared to the SPX, but the overall pattern shows that much greater extremes are required for major turns.


III. Technical Indicators / Other

Looking back at the SPX using daily charts from the lows of 2009, there has been a repeated pattern of strong rallies into the mid-term election year, followed by a correction to the 400 SMA.  In 2014, there was a Sept top followed by a sharp Oct correction, almost identical to 2018, but in 2010 the top was May.  Each time there was a rally to a new high the next year followed by a distribution period of several months before an even sharper decline.  In EW terms this could be called a completed 5 wave cycle, so possibly that's it, but it would feel more appropriate to see more of a distribution period before a major decline.


Taking a closer look at the mid-term corrections, 2010 differed from 2014 due to the lengthy consolidation period between the 100 and 400 SMAs before a breakout.  My feeling is that 2018 is likely to see something similar that could lead to a breakout to the upside if a trade agreement is settled with China by early 2019, but could lead to a breakdown if no settlement is reached


For 2014, the outcome was a sharp V-recovery.  This may be possible if Trump quickly reverses course on China but I view this as less likely.  Some of the stickier points, like intellectual property and tech spyware are likely to take weeks, if not months to work out, so the 2010 scenario seems more likely.


For 2018, we have already seen our first trip to the 100 SMA and a failure, and I would not be surprised to see any rallies stall out near SPX 2700 until after the election.  The election may cause ST volatility, but a Dem win in the House may be positive LT, as this is more likely to force Trump to give up his hard line stance on trade.  Any sign of renewing trade talks is likely to push the SPX to 2800+ for an EOY rally, but when Jan begins another round of earnings may result in a retest of the low 2600s.  With Congress off for Dec, any trade agreement is not likely until Feb/Mar.


As an update to the Trump rally TLs, now that the lower TL is broken it's possible that a rally back to test occurs.  With the current slope the lower TL will be at SPX 2880  in 6 mns.


Conclusions.   The composite indicators do not point to an immediate strong rally as was seen after the Oct 2014 selloff.  Prices could continue lower, depending on whether the patterns of the last two mid-term elections hold.  The best outcome at present seems to be the 2010 scenario where the SPX consolidates between the 100 and 400 SMAs for several months.  If the SPX 2x ETF turns more bearish after a possible EOY rally and retest, a larger rally may be possible.  Even with a trade agreement the fundamental problems with the economy will persist.  A weak rally that fails near SPX 2880 then goes into a distribution pattern for several months could point to a much more serious decline starting the 2nd half of 2019.
 
Weekly Trade Alert.  None.  Not expecting much action until after the election.  Updates @mrktsignals.

Investment DiaryIndicator Primer,  update 2018.03.28  Dumb Money/Smart Money Indicators
Article Index 2018 by Topic
Article Index 2017 by Topic
Article Index 2016 by Topic
Long term forecasts

© 2018 SentimentSignals.blogspot.com

Saturday, October 20, 2018

End of the Wealth Effect

This week I want to start looking at longer term implications of what seems to be a major turn in global central bankers attitudes toward the stock markets.  Over the past few years whenever there was a flareup of economic problems, the first response was always a chorus that the CBs stood by "to do whatever it takes" to prevent another meltdown like 2008-09.  But more recently, in the midst of removing stimulus, the chorus seems to be "hold the course".  My conclusion is that focus has shifted to what could become a generational problem in the "death of the middle class".

The heyday for the middle class was in the 1970's.  Although this is an exaggeration I am going to estimate that roughly 60% of the population in the middle class controlled 50% of the wealth (with 20% poor and 20% rich).  But removal of the gold standard and crushing the labor unions led to pumped up asset prices as central bankers began to focus more on "the wealth effect" whereby higher asset prices are supposed encourage consumers to spend more and increase economic growth.  Stagnant wages were offset for many years by importing low cost goods from China.  The result, however, has been an increased concentration of wealth were 20% of the population controls over 80% of the wealth.  The middle class has shrunk to less than 50% and have resorted to borrowing to keep up their standard of living.

To get back to the CBs, I think they are trying to create a soft landing for the "everything bubble shown below.  Over the next 5-10 years a 15-20% decline in housing prices and a 30-40% decline in stock prices is probably required to deflate the bubble and bring prices back to a supportable level.  This will be accomplished by higher interest rates and monetary tightening.  The question is can this be accomplished without another dot-com or housing type crash.  Link to article.


I. Sentiment Indicators

There is little change in overall sentiment this week as bearish sentiment is very high for the SPX, but does not preclude a short but sharp move lower.   For the indicators this week the period covered is June 2017 thru current period.

The overall Indicator Scoreboard (INT term, outlook two to four months) has now spiked to a level  of the SPX Feb price lows.


I also want to take a look at the LT view of the CPC Revised (combined options less VIX options).  The overall trend since 2015 is a gradual reduction in bearish levels which supports a long term bearish outlook for stocks.


The INT view of the Short Term Indicator (VXX $ volume and Smart Beta P/C, outlook two to four months) has now reached the level of Aug 2017, but note that the Mar retest did not occur until after a significant drop in sentiment.  Supports the Aug 2015 flash crash rebound more than the Oct 2014 continuation.


Bond bearish sentiment (TNX) increased sharply last week which still supports the post Feb 2018 leveling off of rates scenario.


For the INT outlook with LT still negative, the gold miners (HUI) bearish sentiment remained near the SELL level as prices consolidated near HUI 155.


II. Dumb Money/Smart Money Indicators

The Risk Aversion/Risk Preference Indicator (SPX 2x ETF sentiment/NDX ETF sentiment, outlook 2 to 4 days/wks) as a ST/INT indicator remains near the top of its TL and remains positive for stocks.


The option-based Dumb Money/Smart Money Indicator as short/INT term (outlook 2 to 4 days/weeks) has actually risen to a slightly higher level than either Aug 2017 and Feb-Mar 2018, indicating strong support for stocks over the next 1-3 months (expt option horizon).


The INT term SPX Long Term/Short Term ETFs (outlook two to four weeks) bearish sentiment remains at low levels as complacency by longer term (2x) ETFs compared to ST (3x) remains high.


The long term NDX Long Term/Short Term ETF Indicator (outlook two to four weeks/ months) remains elevated, but pulled back from the extremes a week ago.


III. Technical / Other

Last week, I mentioned that I preferred the comparison the the flash crash of Aug 2015 for the recent decline to the Oct 2014 washout, and I posted on Twitter Wed that the early weeks SPX bounce could fail at < 50% retrace, then retrace 62% of the bounce to about 2750.  Thur provided the drop that may still fill the gap at 2750, but a continuation of the pattern could reach SPX 2850s early Nov.  A second leg down may occur late Nov if Trump follows thru on the threat of 25% China tariffs.  This still seems to point to a lower top in Jan.


IV. Options Open Interest

Using Thurs close, remember that further out time frames are more likely to change over time.  This week I will look out thru Oct 31.

With Fri close at SPX 2768, Mon has huge support at 2700 if the market falls, and secondary support at 2750.  Higher prices to 2800 are possible.  Light open int overall.


Wed has very large put open int at SPX 2850, but are unlikely to effect prices.  More likely is a range of 2775 to 2800.


Fri shows larger open int with large net put support up to SPX 2800.  Over 2800 there is little resistance until 2825 and over that 2850 is possible.  Most likely is 2800-25.


For the EOM, the outlook is pretty much the same as the 26th as put support should hold the SPX over 2800, but puts and calls net out at higher prices and should not effect SPX price levels.


Conclusions.  Last week was supposed to be a trading range so a 1 pt gain made it a good call.  The move up was larger than expected, but supported the Aug 2015 flash crash comparison as did the late week retreat.  Next week should be pivotal, as follow thru to the downside aligns with Oct 2014, while upside bias with whipsaws likely supports continuation of the flash crash scenario.  Longer term, based on the central bank outlook, LT CPC Rev, and SPX ETFS a more protracted bear market with less extreme price drops is looking more likely.
 
Weekly Trade Alert.  Last weeks outlook to take a two week vacation seemed appropriate except for day traders.  We could see weakness early to fill the gap at SPX 2750, but there seemed to be a lot of angst Fri with the anniversary of the Oct 1987 crash, so a mild beginning could lead to fireworks by end of week.   Updates @mrktsignals.

Investment DiaryIndicator Primer,  update 2018.03.28  Dumb Money/Smart Money Indicators
Article Index 2018 by Topic
Article Index 2017 by Topic
Article Index 2016 by Topic
Long term forecasts

© 2018 SentimentSignals.blogspot.com

Saturday, October 13, 2018

Keyhole Exit

Over the past few weeks I have been pointing out that too many traders were relying on SPX 3000+ as a point to sell longs or go short and this week we saw the result as sellers were forced to use a keyhole exit. Bearish sentiment has now reached extremes that could support a substantial rally, but many traders are likely to view advances as a glass half empty and gains will be hard fought. An unusual aspect of this decline is that selling by SPX ETF smart money has outpaced dumb money, indicating that longer term much more downside is likely.

I've been thinking about adding a section on expert reviews, so this I am going to cover three that have done reasonably well lately with links to free posts.  Virtually all EW analysts are now calling for a 15 to 20% decline, but I am highly skeptical of consensus forecasts.  I looked at one EW analyst's forecast for Oct 2007 and he was Med/LT bullish projecting SPX 2010 by 2010.
  • Avi Gilbert (EW) has been the most bullish calling for SPX 3000+ by EOY and 3200+ early 2019.  He did indicate that a break of 2880 could go below 2800 and eliminate the 3200 target, and below 2770 would eliminate the 3000 target.
  • Pretzel Logic (EW) has been the most bearish, viewing the Feb 2018 decline as the first leg of an ABC with a possible new high for the B wave with a C crash wave to follow.  A 2872-2532, B 2941, C 2400s.
  • Raj (Timing&Cycles) called 09/21 top, 10/11 st low with retest later.  He doesn't give LT projections but others show LT cycles still up.
Finally, I've been distracted the last couple of months with personal projects and have not been actively trading, so I apologize for missing last weeks downturn.  The biggest surprise was the VIX call indicator, but it may have suffered the fate of the XIV in Feb as the option writers accounts were probably blown up when the VIX went from 9 to 50 in one month.

I. Sentiment Indicators

The overall Indicator Scoreboard (INT term, outlook two to four months) has risen to levels comparable to both the Aug 2017 and Feb 2018 selloffs which were each followed by SPX 400 pt rallies.


The INT view of the Short Term Indicator (VXX $ volume and Smart Beta P/C, outlook two to four months) has reached the stage of the second Aug 2017 low but is well below the Feb 2018 lows.  A choppy upward bias trend over the next few weeks could match the 2017 sentiment, while lower prices seem required to match the Feb 2018 levels.


Bond bearish sentiment (TNX) surprisingly rose even as rates fell last week, matching the Feb 9 level  at the stock market lows that day.  This may indicate that bond holders are more likely to move into stocks.


For the INT outlook with LT still negative, the gold miners (HUI) bearish sentiment fell sharply as the HUI rose over 150 with the stock panic last week.  Prices are not likely to rise much higher.


RUT (small cap) bearish sentiment also rose sharply as prices crashed back to the Dec 2017 level.  Small caps are likely more sensitive to raises in the Fed fund rates since they borrow money at the prime rate (FF rate + 3%) plus 1-2%.


II. Dumb Money/Smart Money Indicators

The Risk Aversion/Risk Preference Indicator (SPX 2x ETF sentiment/NDX ETF sentiment, outlook 2 to 4 days/wks) as a INT indicator has finally risen to the top of its TL, but is a long way from previous major SPX lows.


The option-based Dumb Money/Smart Money Indicator as short/INT term (outlook 2 to 4 days/weeks) has reached extremes seen both Aug 2017 and Feb 2018.  At least a ST bottom should be close at hand.


The INT term SPX Long Term/Short Term ETFs (outlook two to four weeks) bearish sentiment actually fell as selling in the smart money (3x) was stronger than dumb money (2x).  The levels are still near the Dec 2017 levels, so this may not be immediately bearish, but is a warning flag.


Long term view of the NDX Long Term/Short Term ETF Indicator (outlook two to four weeks) saw bearish sentiment rise to the highest level since late 2016.  So far since 2015 there have been several sudden 10% selloffs in the NDX and all have come back.  It's hard to see a bigger decline in the SPX unless this trend is broken.


III. Options Open Interest / Other

Given the huge price swings this week, the options open int outlook is probably useless so I am going to take a break this week.

With the VIX Call Indicator not working, it looks like I will have to go back to using the VXX $ Vol as a volatility indicator as it did give a SELL recently similar to the Aug 2017 and Jan 2018 tops, but there were several false positives the first half of 2017.


IV. Technical Indicators

I just wanted to cover two charts listed on the Twitter updates last week.  The first is the Oct 2017 crash scenario after a high vol Sept opt exp ATH.  This Oct got off to a slower start, but after the first decline there was about a one week consolidation before the final sharp leg down thru the 200 SMA.  Next week may consolidate, then we see what happens.


The second is a look at the entire Trump rally from Nov 2016.  I have been expecting a retracement to about 2100 which was delayed by the corp tax cuts.  I don't use EW, but as long as the SPX holds the lower TL (about 2740), this could be corrective.  For this purpose, last week would be like the Aug 2015 flash crash that rallied to lower highs in Nov and Dec 2015 (from May highs) w/ larger correction 5 months later.  The timing would stretch a final lower high to Jan-Feb 2019 when the one time boost in EPS growth from tax cuts goes away.  This is my preferred scenario.


Conclusions.  Most of the sentiment indicators, except the SPX ETFs, show that a major bottom is near if a Aug 2017 bottom occurs.  Sentiment can always get more extreme, but the consensus for a 15-20% correction based solely on price behavior seems extreme,  especially when the result is supposed to be a huge following rally.  More likely with bond int rates leveling off, this becomes another "flash crash" or buying opportunity.  The SPX LT/ST ETF Indicator is, however, showing that dumb money has not seen enough selling, so longer term more lows are ahead.  2019-20 are likely to see lower GDP and  EPS growth due to higher int rates and falloff of stimulus, both of which should lead to lower stock prices.  Without a recession, which I doubt, there won't be more QE, negative rates or other stimulus to create a giant rally.  If anything, if GOP loses House then Presidency in 2020, a corp VAT tax is likely since the GOP corp tax cut to match the EU and others failed to mention that everyone else has 10-20% VAT in addition to corp taxes, and the corp tax cut boost will get reversed.
 
Weekly Trade Alert.  Best to wait and see for a couple of weeks.   Updates @mrktsignals.

Investment DiaryIndicator Primer,  update 2018.03.28  Dumb Money/Smart Money Indicators
Article Index 2018 by Topic
Article Index 2017 by Topic
Article Index 2016 by Topic
Long term forecasts

© 2018 SentimentSignals.blogspot.com

Saturday, October 6, 2018

Stocks and Bonds Retreat

Two weeks ago, I warned that sentiment in bonds was similar to Dec 2017 before the TNX run up from 2.5% to 3% and last weeks' Twitter update early Wed showed that bearish sentiment declined to the Jan level where rates went vertical.  The next three days saw a jump from just over 3% to 3.25%.  Comparing this move in rates to Dec-Jan, the earlier rise totaled 0.6 percent from a Dec 2.3% so similar sentiment may imply a move to 3.4% initially from 2.8% in Aug with higher rates in time.

Last week, I warned that the stock market sentiment was similar to Aug 2017 where a decline of SPX 70+ pts, including two large daily declines over a two week period.  The result was a massive increase in bearish sentiment that lead to the melt up thru Jan.  Last weeks decline was similar in size, but bearish sentiment was surprisingly mild.  Will next week see more downside until bearish sentiment rises or will the bounce end up disappointing?

I. Sentiment Indicators

The overall Indicator Scoreboard (INT term, outlook two to four months) climbed sharply last reaching the level of the early Aug 2018 decline, but nowhere near the Aug 2017 pullback.  Conclusion, potential for as much as SPX 100 pt rally next two to four weeks.


The INT view of the Short Term Indicator (VXX $ volume and Smart Beta P/C, outlook two to four months) also matched the early Aug 2018 bearish sentiment, but rather tame compared to Aug 2017.  Conclusion, unlikely to generate strong rally similar to late 2017.


Bond sentiment (TNX) rose modestly to neutral similar to Jan that may indicate a continued rise to the 3.4 to 3.5% level before bearish sentiment puts the rate rally on hold.


For the INT outlook with LT still negative, the gold miners (HUI) bearish sentiment seems to have stabilized below neutral as prices hold the 140-50 level.


II. Dumb Money/Smart Money Indicators - using all INT time frames this week

The Risk Aversion/Risk Preference Indicator (SPX 2x ETF sentiment/NDX ETF sentiment, outlook 2 to 4 days/weeks) as a ST/INT indicator remains near the bottom of its TL, showing preference for risk (NDX) remains high - a negative.


The option-based Dumb Money/Smart Money Indicator as ST/INT term (outlook 2 to 4 days/weeks) has also reached the levels prior to the Aug and Sept rallies that could mean an SPX 60 to 100 pt rally from the lows.


The INT term SPX Long Term/Short Term ETFs (outlook two to four weeks) bearish sentiment is relatively unchanged for the week at well below neutral.  Looking more closely at separate ETF 2x/3x charts below, we see that this is due to strong selling by both long & short ETFS.  The conclusion is both good and bad as the Dumb (2x) ETF selling is positive for the next few weeks, while the Smart (3x) selling is similar to that leading up to the Jan top, so the next high may be the last for a while.


The SPX ETF Dumb Money sentiment (2x) ST has risen to levels similar to Aug 2017, the highest since the June SPX 100 pt decline.


The SPX ETF Smart Money sentiment (2x) ST has risen even faster matching levels seen about two weeks before the Jan top as smart money was exiting well before the Feb crash, but were also heavy buyers mid Oct 2017 at the beginning of the rally.


Long term neutral, the INT term NDX Long Term/Short Term ETF Indicator (outlook two to four weeks) has risen to levels that were followed by moderate rallies in Aug and Sept.


III. Technical / Other

Last weeks decline was unusual in that the decline was on low volume and concentrated in large cap tech stocks.  The result was that some of the indicators as TRIN do not show oversold/panic while others as NYMO do, so I just wanted the briefly mention the Technical Indicator Composite of NYMO+TRIN+NYAD +NYUD.  Here, we see sentiment consistent with a moderate, but not strong advance.


Also as a followup on int rates, several times earlier in the year I noted that the TNX (black) was mostly following the two year T-Note (red) higher, and although last weeks rise in TNX rates seemed unexpected the result was just a catch up to the UST2Y.  Apparently, since June the trade war talks had resulted in an inverted yield curve due to slower growth concerns, but recent data shows the opposite, probably due to retailers loading up on merchandise from China before the holiday shopping period when higher tariffs may be put in place.  The increase in the trade deficit must have Trump scratching his head.


IV. Options Open Interest

Using Thurs close, remember that further out time frames are more likely to change over time.  This week I will look out thru Oct 12.  Put support is likely to be much stronger than shown due to Fri selloff.  Mon/Wed/Fri looks pretty much the same with put support up to SPX 2900-10 and call resistance from SPX 2920-5.

With Fri close at SPX 2886, Mon has very light resistance up to 2920 if the market rallies, while declines have strong support at 2850.  Light open int overall.


Wed is somewhat similar except that strong put support appears at SPX 2880, and strong call resistance is at 2920.


Fri shows larger open int with very strong put support at SPX 2900 (last week it showed 2880) and strong call resistance at 2925.  Currently, SPX 2910-5 is the expected close.


Conclusions.  Last week was a condensed version of what I was expecting over a couple of weeks as the bond implosion pushed stocks lower ST.  Next week is likely to be volatile but both ST sentiment  and options OI indicates the the market should stabilize over SPX 2900.  Looking further out, the recent comparisons to the Nov-Dec 2015 topping period may turn out to be more prescient than expected.  Sentiment supports a two to four week rally of SPX 80+ pts that may reach 2950-60 early Nov, but that a 10%+ decline is likely to start soon thereafter. 

The risk aversion indicator's low readings for the past couple of months have been warning of tech weakness and we saw continued evidence of that last week.  Tech stocks are effected by something bond investors call duration where longer term/lower coupon bonds vary more with int rate changes because capital returns are discounted more heavily when capital is received further out.  Tech stocks that pay little or no dividends are like zero coupon bonds.  As discussed in Feb, the sharp rise in int rates in 1999-2000 probably contributed to the tech stocks demise.

As a final note, after checking the historical data for 1987, the int rate problem with comparison to dividend yield was for the DJIA that now has a 1.9% yield, so the problem area would be when the TNX reaches 3.8-3.9%.
 
Weekly Trade Alert.  Mostly BTFD, but seriously the risk/reward for longs is not very tempting and I see no reason to short.   Updates @mrktsignals.

Investment DiaryIndicator Primer,  update 2018.03.28  Dumb Money/Smart Money Indicators
Article Index 2018 by Topic
Article Index 2017 by Topic
Article Index 2016 by Topic
Long term forecasts

© 2018 SentimentSignals.blogspot.com