Saturday, June 24, 2017

Humpty Dumpty Time

Last week was rather boring price wise with the SPX up only 5 pts, but under the hood volume has been picking up, especially on up days.  Is the public finally drinking the Koolaid?  Today I want to finish up the volume technical indicators by fine tuning the High Risk Indicator, adding a Capitulation Indicator shown on Twitter and adding a long term BUY/HOLD/SELL and Crash Indicator.

I. Sentiment Indicators

There was not a lot of change last week, so this will be brief.  The overall Indicator Scoreboard retreated to a more bearish position as the SPX moved sideways.


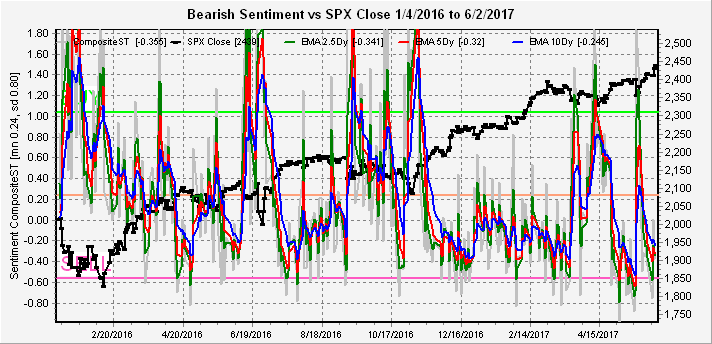
The Short Term Indicator (VXX $ volume and Smart Beta P/C) has not reached the SELL level last seen before the mid-May decline, so today I am going to focus on the components.  The VXX $ volume has dropped to the SELL level, but this alone has not been sufficient for much of a decline since the election.


The Smart Beta P/C continues to be the key for the Short Term Indicator as continued ETF hedging keeps this indicator from reaching the SELL level.


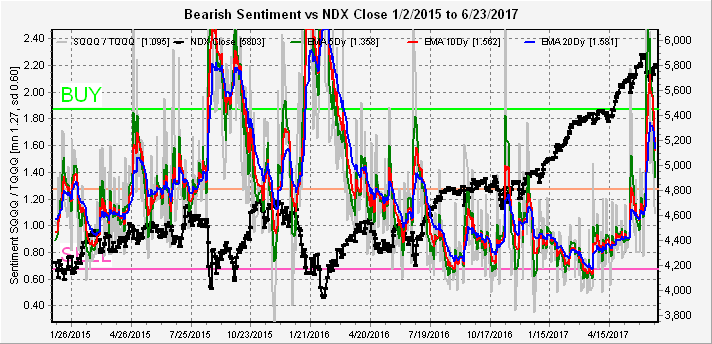
Before moving on, I want to take a look at one sector which may the culprit and that is the NDX/QQQ sentiment measure using the SQQQ/TQQQ ratio.  As you can see this reached the BUY level and appears to have plenty of room for prices to move higher.


Sentiment for bonds (TNX) is consolidating at lower levels as interest rates have regained about half the loss since the election, but continues to face strong headwinds from higher short term rates and QE unwinding as well as higher inflation prospects from the Republican agenda.


Sentiment for gold stocks (HUI) with ST EMAs moved to slightly less bearish as prices seem to be coiling for a breakout one way or another.


II. Options Open Interest

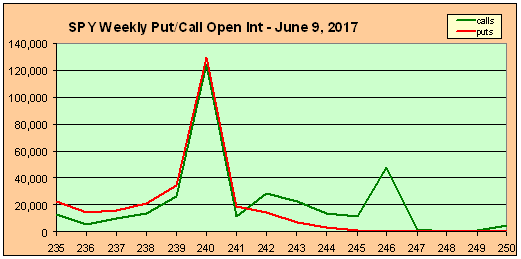
This week I am going to take a quick look at Friday's options, then look ahead for the next quarter by options expirations.  For June 30, the likely range is 242 to 245 with the most likely 243.5.  Note with SPY going ex-div SPX 2440/1 equals SPY 243.5.


For the monthlies in July, the range is much wider from SPY 240 to 247, so is probably the best chance for a move to 246-7.


For August, we have a setup almost identical to the QQQs in May where the most likely level is SPY 244 with identical puts and calls, but a move lower could quickly start delta hedging, pushing the SPY down to the 235 level.  (So potential for mini crash.)


September is even more interesting with a bi-modal setup.  This seems to reflect the outcome for a vote on the Trump tax cuts, pass then SPY goes to 250, don't pass the SPY goes to 230.  Most likely is 240, but small number indicates low probability, and since puts (support) are slightly larger than calls (resistance), probability of up move seems more likely.


One last look at GDX shows a lower likely range of 20-23, but a move over 23 may result in delta hedging upwards to 24 then a sharp whipsaw as we saw in the NDX.


III. Technical Indicators

For some time I have been interested in volume indicators and earlier this year I noticed that the TRIN (which compares the number and volume of advancing and declining issues) pointed to strength while other indicators did not.  So when I finally got some free time, last week I showed a volume based (lower supporting volume means higher risk) High Risk Indicator $NYAD:$NYUD, now revised to a 20 day SMA and cutoff of 5.0 that gives about a one month warning before a top.  Then last week I came up with a Capitulation Indicator $NYDNV:$NYDEC, where high volume on declining issues points to a bottom.  Interestingly both of these are at critical levels, but the Capitulation Indicator seems to be shorter term, so the predicted result would be higher prices first then a sizable decline.

The third volume indicator I found just playing around with LT SMAs and I am calling it the BUY/HOLD/SELL/Crash Indicator, $NYUPV:$NYDNV.  Results varied greatly before 2013, but since then the 200 day SMA indicates SELL (not short) when the level drops to 1.5. seen Dec 2015 and last week, BUY when 2.0 is reached and HOLD to SELL.  The 100 day SMA seems to work as a Crash Indicator when the value drops below 1.5 for a period of time; this occurred three times since 2013, Sept-Oct 2014, July 2015, and May-June 2017.  So no guarantee what will happen this time, but the last half of 2014 is starting to look more likely.

Conclusions.  Not much has changed since last week, except the day to day comparisons to 2014 seemed to fail, but similar results may still prevail.  Technical indicators show higher prices short term are likely, but there is increased risk longer term.  Sentiment agrees.  Options open interest point to SPY 247 as a possible high between now and July 21, with the possibility of a decline into Aug 18 to SPY 235.  September seems to be an interesting month depending on the outlook for the Trump tax cut program.

Weekly Trade Alert.  I am going to preface my comment with a chart.  The last three months seem to be a series of bull and bear flags.  The latest, an upward sloping bear flag looks to need one more high that should be in the SPX 2460s next week or 2470s the week after.  A breakdown would probably test the 50 day SMA.  Result, Short on test of upper TL, target 50 day SMA.


   Updates @mrktsignals.

Article Index 2017 by Topic
Article Index 2016 by Topic

© 2017 SentimentSignals.blogspot.com

Saturday, June 17, 2017

No One Can Predict the Future

..., but we all try.  This week, I am going to add a special section in addition to the sentiment indicators and option open interest.  Last week I spent several hours looking at historical charts and also discovered a simpler, but just as effective, high risk indicator that just fired last week.  These technical indicators as well as last week's GDX analysis point to a top for SPX in July.

I. Sentiment Indicators

The overall Indicator Scoreboard showed that bearish sentiment rose steadily due to fallout from the tech decline even though prices were mostly flat outside of intra day declines.  Similar trends in August 2016 was followed by lower prices, but in January by higher prices, so likely no imminent top.


The Short Term Indicator (VXX $ volume and Smart Beta P/C) using INT EMAs likewise rose with similar comparisons and conclusions.


Bearish sentiment for bonds (TNX) has moved back to the neutral range even though rates were flat which seems to indicate less demand for safety.


Sentiment for gold stocks (HUI) with ST EMAs provided the biggest surprise of the week, dropping to the recent SELL level,  as BTFDers seem to expect the trading range (GDX 22-24) to hold up even though the options open interest shown last week showed that the range into July expiry (7/21) was likely to be GDX 21-23 or lower (HUI 160).


II. Options Open Interest

I did receive a question about the monthlies last week, so for those unfamiliar with options, the original monthly options expire the third Friday of the month.  I will in the future try to use specific dates for clarity.

This week I will look at the Wed/Fri options as well as the June EOM (6/30).  The Wed options show a surprisingly tight range between 243-4 with previous close at 242.6 and most likely Wed close at 243.5.  Fri options show more bullish potential up to about the 246-7 level.  Put resistance is fairly low, however, so downside surprises are possible.


The next (EOQ), shows more call resistance that is likely to push prices back down to SPY 243-4 level.


Looking forward to the July monthlies, there is a fairly flat range between SPY 240 and 246 with very stiff resistance at 247.


III. Technical Indicators

About a month ago, I revised my outlook upward based on a study of several bear market tops that showed rallies of 18-20% in the final six to eight months as a way to run in the shorts or "strangle the bear" as I called it last week,  In particular, since I am looking for a 1970s outcome long term as a result of the QE quagmire, the first step would be a 1970-72 type bear market that was surprisingly mild, down only 20% after 2.5 years, before a final collapse that totaled 33%.  The final 1960s rallies were 18 and 19% depending on which top you chose so the result from the 2016 election lows is SPX 2470-90.

The second item which I also noticed comparing 2017 price behavior to the past was the amazing similarity to 2014.  Starting in Feb of both years, the SPX rallied strongly into early Mar, then started a trading range for three months of about 1900 to 1820 in 2014 and 2400 to 2320 in 2017.  More amazing is that the numbers are off by an almost exact 500 pts.  Both rallied out of the trading range in late May into early June to 1950 in 2014 and 2446 in 2017 with mid June pullbacks.  In 2014, the SPX then rallied to 1960 late June before an EOM pullback to 1945, and early July hit 1985 with a larger pullback before a final July high of 1991.  Will the SPX reach the same targets by adding 500 in 2017?  Note prices eventually continued higher in 2014, but the sentiment picture was vastly different than today as shown by the LT SDS/SSO chart below.


The final technical indicator I want to cover today is a simplified version of the high risk composite I discussed several weeks ago as a measure of declining volume support for advancing issues shown using the TRIN, this indicator is the $NYAD:$NYUD which gives a warning about a month before an important top with a spike over 6.0.  The five readings over the past two years included Oct 2015, Mar-Apr 2016, July 2016, Apr-May 2017, and last week.  This may be due to the smart money (high volume traders) pulling out leaving the dumb money to pick up the crumbs.

Conclusions.  Normally, I don't place a lot of confidence on historical analogs, but continued moderately high bearish sentiment seems to align with the 2014 analog so it may be worth a close watch.  I may take a couple of short term trades off book where the options OI align with the 2014 analog.

Weekly Trade Alert.  None, any sentiment changes will be posted one hour before the open when relevant.   Updates @mrktsignals.

Article Index 2017 by Topic
Article Index 2016 by Topic

© 2017 SentimentSignals.blogspot.com

Saturday, June 10, 2017

Bubble Trouble

All week I had been thinking of a chart I saw a few years ago posted by John Hussman which symbolizes something called a Sornette bubble.  The primary characteristic is that as prices move toward a top pullbacks become shallower, but more frequent.  Since the mid-May pullback in the SPX of 2% that lasted only two days, all ST SELL setups seems to evaporate as prices continue to melt up.  Friday may have been the extreme example where a 30 pt SPX pullback occurred in a matter of hours and just as quickly reversed. Just to be clear, I am not predicting a crash.


This week, I will continue to look at sentiment indicators as well as options open interest to gauge sentiment for forward months.

I. Sentiment Signals

The overall Indicator Scoreboard saw a sharp drop last week, mostly with the collapse of the P/C ratios all week and especially Thur when the CPC reached 70%, giving an INT SELL on Thur.  This is usually an early indicator with a two to four week lead.


The Short Term Indicator (VXX $ volume and Smart Beta P/C) using INT EMAs reached a pseudo SELL level, but the Smart Beta P/C refuses to decline so I am somewhat skeptical at this point.


The Short Term Indicator (VXX $ volume and Smart Beta P/C) using S/T EMAs gave a ST SELL Mon as posted on Twitter and came close to a retest on Thur.


Bearish sentiment for bonds (TNX) has continued to fall to a full SELL even as rates rose slightly.  Some are saying that the FED is likely to start reducing its balance sheet by selling bonds by the EOY so this may place a floor on rates.


Gold stocks (HUI) had the move I had been expecting to test the 200 SMA on Tues then started to sell of sharply, but the reaction shown by sentiment was unexpected.  There was no SELL at the high, but as prices pulled back, bearish sentiment continue to fall (BTFD) now matching the levels of the previous small pullbacks.  This leads me to believe that the HUI may be starting a megaphone pattern of lower lows (GDX 20-1) then breakout highs (GDX 25-7), then a larger collapse.  This pattern is explained in the options open interest section.


II. Options Open Interest

Last week, I showed that a large number of Wed calls at SPY 244 would likely put a lid on the market (actual range 243-44), but that by Fri prices could move higher but could also move down to the 241 level (actual range 242-45).  The way it happened was a surprise but the SPX moved almost identical to the May 17 performance of the QQQ as reported two weeks ago where the QQQ went from the upper call resistance at 140, then down to just above put support at 135.  The QQQ then zoomed to 2% above former resistance then had a bigger collapse, can the same happen to the SPX?

This week I want to look at some of the forward months to see if there are any clues to market direction.  June is triple witch EOQ option expiry so may be volatile.  Even though Fri low was 242, the close at 243.4 makes delta hedging a possibility to push prices higher, but 245 is a big hurdle.  The FED may add "data dependent" to its notes for future hikes which will be a green light for the bulls.


Looking forward to July and Aug are tenuous as changes are made each month as rollover occurs, but as of now July shows a huge block of resistance at SPY 247 and below that the 242-3 level looks likely.


In August resistance moves down to SPY 245 with a likely pin at 240, but with possible delta hedging lower below 240.  The lowest price possible seems to be 235.  So overall, consistent with a pullback, but no crash.


Just to take a quick look at the QQQ, Fri saw a drop from 144 to 138 then a close at 140.  We may see something like this in the future for the SPX.


Next I want to do the same for the GDX open interest using July and Sept.  For June, we still have the 22-24 support/resistance levels with even more resistance above, so not likely to go over 24.


For July, the big thing here is that resistance moves down to 21 with strong support at 20.  So given the DUST/NUGT sentiment this points to a likely move to 20-1 by mid July.


For Sept, there is strong support at 23 and below with a likely target of 25 and over that delta hedging is possible.


Conclusion.  Occasional bouts of volatility aside, a top in the SPX the next two or three weeks followed by an 8-10% (revised) pullback seems likely.

Weekly Trade Alert.  None, any sentiment changes will be posted one hour before the open when relevant.   Updates @mrktsignals.

Article Index 2017 by Topic
Article Index 2016 by Topic

© 2017 SentimentSignals.blogspot.com

Saturday, June 3, 2017

Strangling the Bear

Another exciting week, especially for the reaction to economic releases.  Tuesday's small pullback produced a ST SELL using the ST Indicator (posted on @mrktsignals) and the next day weak Chicago PMI data (later reversed) sent the SPX down to fill the 2405 gap, then ramped up after hours.  The late surge anticipated the strong ADP jobs numbers and the SPY surged up to the 242-3 resistance, but by mid-day the bears were dancing shown by the high P/C on CBOE intra day listings so a warning was posted not to short and that SPY 245 might be seen with delta hedging from call writers having to buy futures.  Friday's release of the official jobs numbers were only 50% of the ADP numbers, but the markets seemed unfazed and closed on the SPY 244 level.  So it looks like the expected July-Sept pullback will occur from higher levels as SPX 2500 is in sight by the end of June.

I. Sentiment Signals

The overall Indicator Scoreboard declined only slightly and, considering that the last INT SELL only produced a two day pullback of 2%, it is unlikely to produce a significant SELL next week.


The Short Term Indicator (VXX $ volume and Smart Beta P/C) using INT EMAs is in much the same situation.


The Short Term Indicator (VXX $ volume and Smart Beta P/C) using S/T EMAs is shows the Tue SELL signal which was only good for 15 SPX pts.  A SELL may be produced next week but is unlikely to result in a significant pullback


Bonds (TNX) continued to show strength and are almost at an INT SELL level for the TBT/TLT.  Given the weak jobs numbers, it appears the CEOs are delaying investments and hiring until the Trump troubles are cleared up.


Sentiment for gold stocks (HUI) is about as neutral as it gets, juggling the weak USD vs lower inflation expectations from a weaker economy.


II. Options Open Interest

The resistance for the SPY at the 242-3 level did not prove to be as important as expected.  I wondered if this might happen given the ease the NDX/QQQ, shown last week, blew thru the 140 level (now 143.5) after failing at that level May 16-17.

Looking at the weeklies for next week, the Wed call resistance (6/7) may prevent a rise over 244-5, but Fri (6/9) resistance rises to 246 so a late week advance is more likely.  A pin Fri at 240 is the conventional interpretation but seems unlikely in the current market


The combined Weekly+Monthly is about the same as last week and shows lower resistance at higher prices with possible delta hedging from call writers forcing prices higher.  It is possible if a SELL is generated by Wed that a short term pullback as low as SPY 241 could happen by Fri that may coincide with the Comey testimony, but like the QQQ action in mid May this would be a BTFD.


The June EOM/EOQ OI clearly shows that the most significant resistance to higher prices is at the SPY 250 level (SPX 2500), so it seems likely that we move toward that level before a significant correction.


Conclusions.  The bears persistence to short every new high is their own undoing.  This is easily seen by the high intra day P/Cs and the explosion of VXX volume the last hour of trading.  Although still learning to the options open interest, it has helped me to see the markets zones of resistance. Next week, I will take a look at the July and August OI charts that point to lower prices.

Weekly Trade Alert.  None really other than the BTFD possibility later this week.  I have been posting any sentiment changes one hour before the open when relevant.   Updates @mrktsignals.

Article Index 2017 by Topic
Article Index 2016 by Topic

© 2017 SentimentSignals.blogspot.com