Saturday, February 24, 2018

All Options are on the Table

The stock market traded in a fairly narrow range all week of SPX 2725 +/- 25 pts as warned on Twitter early Tue AM when I saw that an immediate top was unlikely.  Also on Wed, I noted that the very large put open int on SPY for next Fri indicated a potential run up to the SPX 2800+ area.  This puts us in an interesting fractal with the Aug 2015 flash crash right before its retest of the lows.  Interest rates (TNX) have flattened over the last two weeks and combined with sentiment have almost ruled out the 1994 "bond crash" scenario.  Last week I also made a revision the the 3x ETF sentiment calculations for the BKX and NDX as noted in the Investment Diary.

I. Sentiment Indicators

The overall Indicator Scoreboard remained very high but is now below the level of the 2015 flash crash prior to a retest.


The Short Term Indicator (VXX $ volume and Smart Beta P/C) has also fallen to levels below that prior to the 2015 flash crash retest.


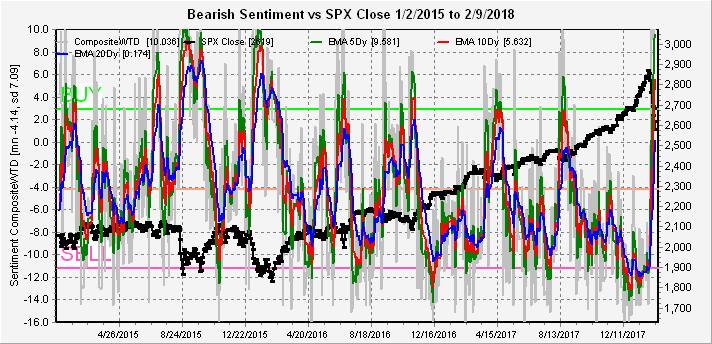
Looking at two of the equity ETFs, first the "buy and hold" SDS/SSO for the SPX, the level of fear indicated by the extreme bearishness resembles that after the Jan 2016 decline when many EW analysts were calling for a new bear market, but was instead followed by a 50% rise over the next two years.


Also, looking at the "revised" NDX SQQQ/TQQQ ETF ratio, bearish sentiment is literally off the chart as the readings maxed out at 1.45,1.25 and 1.05 (5,10,20 EMAs) on Feb 12 and still remain over 1.0.  It is hard to say what this means for the NDX, but another 500 to 1,000 pts may be possible.


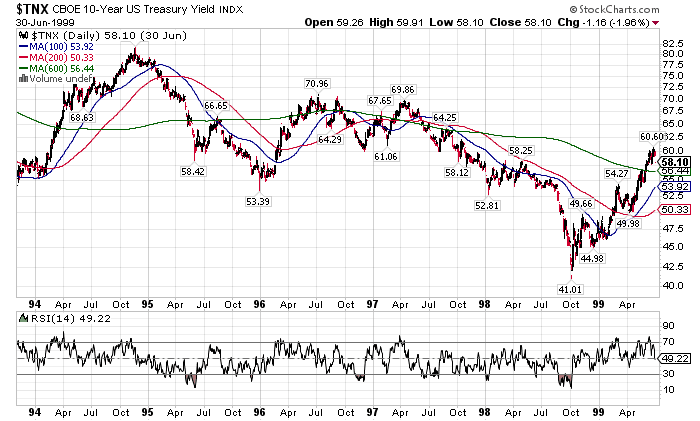
Bearish bond sentiment (TNX) is approaching the levels seen at the end of 2016 following a rise of 1.2%, but a similar rise this time would be to 3.3% so higher rates seem likely after the current consolidation period.  More on what might cause higher rates in the technical indicator section.


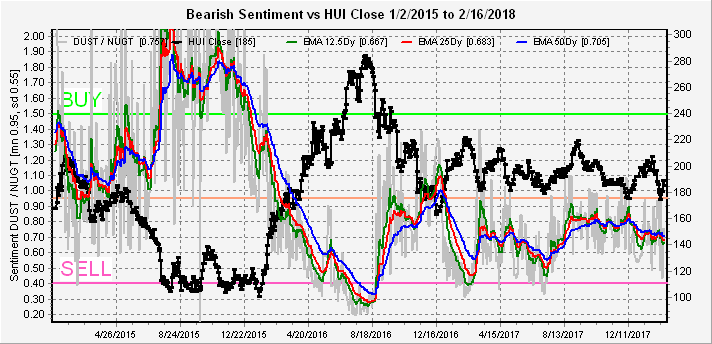
The gold miners (HUI) bearish sentiment continues to be a snooze fest, and prices are likely to drift lower.


II. Options Open Interest

SPY (close 274.7, SPX 2747) starts trading M/W/F options next week.  Mon has only small positions but show delta hedging over 230 with a "most likely" of 272 on a drop below 230.  For Wed, "most likely" is SPY 272-73, but only small resistance from 274 to 278, so a hold over 274 could push to 278 or higher while a drop below is like to move to 272-73.


For Fri, about all you can say is there is strong support at SPY 270 and below, while there is little resistance as far as the eye can see.  As discussed in the TI section for the Aug-Sep 2015 fractal, this would be the ideal place for a "pop and drop" as high as the ATH at 285.


III. Technical Indicators

The recent bond consolidation/bearish sentiment picture makes the 1994 fractal less likely near term, but last weeks action is similar to Sep 2015 before the flash crash retest.  Here we saw a consolidation mid-Sep below SPX 1960 (same as 2018 50 SMA 2730) before a 60 pt or 3% short covering rally on a breakout, which today would be about SPX 2800.  The time frame between the two lows is 5 weeks which would be around the Mar 9 jobs data for 2018.  Longer term, six months after the 2015 flash crash, we had the Jan 2016 decline that could correspond to June 2018 which is more likely to see the next run up in rates (TNX) given current bond sentiment.


A more bullish view by an EW analyst sees the Jan/Feb decline as a 4th wave correction, likely a triangle, before a 5th wave to SPX 3200.  Sentiment using SDS/SSO and TQQQ/SQQQ does seem to support this view.


Finally a look at what seems to be the main driver of higher int rates (TNX) over the last few months, the US two year bond (red). The UST2Y is usually considered to be a measure of the expected Fed funds rate (FFR) plus 0.5% and the TNX (black) seems to be following it higher.  Currently at 2.25% the UST2Y is reflecting a March FFR of 1.75% with 100% certainty, as June approaches, it will move to 2.5% if a rate hike is likely and carry the TNX over 3%.


Conclusions.  Last week saw the early pullback and sharp rally back, but at higher levels than expected.  The opening gap down was a signal that a top was going to be delayed and was warned of on Twitter.  The most interesting fact was that on Wed when the DJIA was up strongly after the Fed minutes release, after the TNX jumped .05%, the DJIA fell over 300 pts; next on Fri when the TNX dropped .05%, the DJIA jumped back up over 300 pts.  Its hard to believe, but sentiment, especially equity ETFs, now seem to be aligning for a 1999 mega blowout in the NDX with SPX in tow.  However, this is also consistent with my favored long term forecast of a 1970-72 type bear market, where we saw a series of 10% corrections every few months (now rising rate fears as well as liquidity crises as in China, etc) with each  correction followed by 70-80% retracements in the DJIA ([75% is 25,800], now due to high bearish sentiment).  We could also see something like mid-2015 on a larger scale, where the SPX had several highs around 2130, while the NDX continued to make new highs.

Weekly Trade Alert.  Next week may be a replay of last week if the SPY options open int is any indication.  We may retest the SPX 50 SMA from above and it should be a buying oppty if bonds hold steady.  Possible consolidation thru Wed with a late week explosion upward with a target of SPX 2800+.  The Wed spike selloff may be a "false positive" making everyone complacent if it happens again, but if Sep 2015 repeats it will be the real deal with a decline probable to at least SPX mid 2600s thru Mar 09+. BUY at SPX 2720-30s, SELL at low 2800s.  The most interesting question is what happens if Fri closes at a high over 2800, will it be like Jan 26 or will the next Mon be a "pop and drop"?  Updates @mrktsignals.

Investment DiaryIndicator Primer,  update 2018.02.23 ETF Sentiment Revision
Article Index 2018 by Topic
Article Index 2017 by Topic
Article Index 2016 by Topic
Long term forecasts

© 2018 SentimentSignals.blogspot.com

Monday, February 19, 2018

Article Index 2018 by Topic

2018.1 Long term forecast. The Only Thing Certain is Uncertainty
2018.01 #1 A strong January is likely to be a misleading indicator pointing to a top aka Jan 2016's sharp drop that was followed by a 2 yr 50% rally.
2018.01 #2 Sentiment indicates pullback by early Feb, VXX % vol drops to level equal month before May 2015 top, ST Indicator SELL. NDX sentiment pts higher to 7000? VIX Call Indicator gives strong SELL.
2018.01 #3 Sentiment indicates ST strength, but increased risk of larger decline afterwards. As int rates (TNX) continue to spike toward 2.7% warning zone, HUI faltering near 200. VIX Feb 14 open int shows risk of higher volatility ahead.
2018.01 #4 Sentiment indicating ending stage of bubble, but NDX bearishness may support more rally. LT SKEW shows breakdown from trend similar to 2007 top.
2018.02 #1 Comparison of 2018 in stocks, bonds & skew to 1999. Perfect storm in bonds could cause 20% crash in stocks 1st half. EOM selloffs may be QE related.
2018.02 #2 Regular sentiment indicating strong bounce likely, but LT EMAs suggest longer correction. Bonds likely to consolidate. 1994 fractal for TNX & SPX shows potential for SPX 2400 and lower next few months.
2018.02 #3 Regular sentiment similar to 2015 Aug flash crash before retest. Bond sentiment may indicate longer consolidation. HUI remains slightly negative. Options OI & 1994 fractal show pullback to SPX 2600 possible near term.
2018.02 #5 Use of 2015 flash crash analog pts to run to SPX 2800. INT retest of Feb lows likely.
2018.03 #1 Looking at SPX options for open int. Expecting possible early week pullback before jobs report, but rally late in week.
2018.03 #2 Switching to SPX options for open int. Increase in VIX calls is a warning. Looking for an SPX top 2800-20.then 2700 or lower.
2018.03 #3 SPX top in for correction thru Mar. Bearish bond sentiment lowers upward pressure on rates. HUI bearish sentiment picking up.
2018.03 #4 Intro to Dumb/Smart Money Indicators for very short term outlook. SPX nearing a bottom, but expect more weakness in NDX.
2018.03 #5 DM/SM Indicators showing likely retest of lows soon, est SPX 2550-70 then 2650. Sentiment consensus of SPX 2400s low makes it not probable. Overall sentiment supports multi-month rally soon.
2018.04 #1 SPX hits expected lows sooner than expt w/ China trade war retaliation. Two month consolidation below 2700 likely before higher levels. High bearish sentiment to hold up prices two-four months.
2018.04 #2 Bearish sentiment lower but still positive for stocks. High bearish sentiment for TNX at 2.8% may mean slower rise in rates. Intro to Risk Aversion Indicator as preference for NDX to SPX.
2018.04 #3 Bearish sentiment for overall Scoreboard and ST Indicators pt to lower prices thru end of April. NDX ETF Indicator SELL pts to lower prices for NDX. Drop to SPX 2650 by EOM could setup sizable May rally.
2018.04 #4 FOMC mid-week may provide early support to SPX, but low ST Indicator, VIX Call SELL, and Risk Aversion SELL & options OI indicate test of lower triangle TL below 2600. A look at several intra day Risk Aversion reads.
2018.05 #1 Strong SPX drop below 2600 was met by news of Buffets increased share in AAPL with strong reversal. Sentiment back to neutral/positive but may see 2740-60 later in May.
2018.05 #2 ST, Risk Aversion, options DM/SM and SPX ETF Indicators warning of small pullback over next few days. Likely test of triangle breakout before move to SPX 2740-60.
2018.05 #3 Options OI indicating early week rally SPX 2750+, but low bearish sentiment pts to larger pullback to 2675 by June 1.
2018.05 #4 Whipsaw likely next week with very ST indicators showing SELL with ST/INT near BUYs. Likely pullback to SPX 2675 then rally into mid, late June.
2018.06 #1 Sentiment improvement & BUY from SPX ST/LT indicator pt to continued rally thru mid-June, then some weakness. Using July 2017 analog.
2018.06 #2 Bearish sentiment fell sharply w/Risk Aversion and SPX ETF Indicator SELLS, expecting highs SPX 2780-90 before pullback to low 2700s.
2018.06 #3 Many indicators have reached INT SELL levels. Expecting INT top w/ SPX 2800+ possible.
2018.06 #4 Trumps trade war threats may have started correction early, INT top likely in. Analog to Nov-Dec 2015 for.SPX 2x ETF indicator may mean 4-5% pullback followed by sharp rally before bigger decline.
2018.06 #5 Sharp rise in bearish sentiment matching the early Nov 2015 pullback indicate a rally to SPX 2770-80 may start soon. Option DM/SM and SPX ETF Indicator reached BUYs. Possible inverse H&S at SPX 2700.
2018.07 #1 Sentiment measures have dropped to neutral, but SPX shows potential for a run to 2800 if 2775 is exceeded on Mon. Consoloidation likely next 1-2 weeks.
2018.07 #2 Bearish sentiment has dropped below neutral, but more upside is likely before a small pullback. NDX is looking more vulnerable to weakness.
2018.07 #3 Trade wars may have unintended consequences of higher US$, lower int rates and inflation. SPX sentiment is low enough to consider as SELL, but options OI indicate early week strength first. HUI at 170 has reached INT SELL that may depend on US$.
2018.07 #4 Relatively mild pullback so far with weakness mostly in NDX. Sharp rebound in options DM/SM indicator looks a lot like Jan run up where bears are over eager, pushing prices higher, but SPX ETF indicator showing mid week SELL so no bottom yet. Support at SPX 2800.
2018.08 #1 Trumps stimulus inflationay effects offset by trade wars slowing growth. Sentiment showing possible run to SPX 2850 or higher, but a likely retest of 2800 is expected later. HUI bearish sentiment at extreme lows of Feb 2017 before crash.
2018.08 #2 Consensus is for a continued pullback to SPX 2790 or lower, but Wall St likely to push prices higher in Aug thru 22nd to record the "longest bull market in history". Risk aversion indicator lows pt to NDX underperformance. Options DM/SM at a BUY. May see ST volatility before higher prices.
2018.08 #3 DJIA may be singing Sirens Song with NDX lagging to lure public in at top, targeting 26.5k. Overall Indicator Comp at levels of prior SPX 70-100 pt rallies. Options DM/SM supports higher prices. Opt OI resistance SPX 2875.
2018.08 #4 Longest bull market accomplished, Sept opt exp may see impt top around SPX 2950. ST sentiment mostly neutral, but opt OI shows potential for early week move to SPX 2900+ with pullback later. HUI down big.
2018.09 #1 Could see mid-Sept top w/Oct 2014 type volatility to follow. Bearish sentiment declining sharply w/NDX in lead. Top is nearing, SPX possible 2935.
2018.09 #2 Small improvement may see brief rally, expect SPX 2920-40 then 2750-2800 in Oct.
2018.09 #3 Both ST Indicator & SPX ETFs showing SELL, but Indic Scoreboard not at Jan level, decline not likely as strong as Jan. VIX Call Indicator not on sell.
2018.09 #4 Indicators are pointing to a pickup in volatility similar to Aug 2017 that could indicate a final rally if sentiment jumps sharply on further decline.
2018.09 #5 Rise in TNX rates over 3% may push investors from bonds to stocks as in Dec 2017, delaying larger stock decline.
2018.10 #1 Bearish sentiment up very little with initial stock decline and may be warning of more to come. SPX 3x smart ETF selling much stronger than 2x dumb. May see one more rally before larger 10%+ correction.
2018.10 #2 SPX decline from 2940 to 2710 saw sharp rise in bearish sentiment, but SPX ETF DM/SM still near SELL so any rally temporary.
2018.10 #3 Bearish sentiment overall still rising, but continued strong selling by SPX 3x ETF smart money is worrisome and next two weeks should indicate markets direction.
2018.10 #4 Longer term sentiment not high enough to match major bottoms since 2014. Election win by Dems may be seen as positive and seen as China trade friendly pushing SPX to 2800+, but no trade progress likely until Mar, so watch for reversal.
2018.11 #1 Normal sentiment is at a level where a bounce can occur, but DM/SM options and ETF as well as SKEW are showing extreme complacency. A decline to SPX low 2600s could rally to 2800.
2018.11 #2 Post election rally sees sharp drop in bearish sentiment, SPX ETF Indicator remains near SELL. Lower prices likely.
2018.11 #3 SPX 100 pt drop intra week left sentiment unchanged. Trade talks may see hope rally, but not much progress is expected and could send SPX to low 2500s. Decling bond bearish levels supports TNX move to 2.5% by mid 2019.
2018.11 #4 A repeat of last weeks 100 pt drop in SPX again left sentiment unchanged. Options DM/SM indicates continued drop after possible bounce toward 2800. $NYUPV/$NYDNV shows same pattern as before Aug 2015 flash crash.
2018.12 #1 Rally to SPX 2750 moves options DM/SM to strong SELL. High equity p/c shows same upward trend in weeks leading up to Aug 2015 flash crash.
2018.12 #2 Decline below SPX 2650 leads to sharp increase in bearish sentiment for normal indicators, but options DM/SM still near SELL and SPX ETF indic unfazed. Significantly lower prices likely to get dumb money to sell. May see botom near 2500 at FOMC.
2018.12 #3 Move to SPX 2600 finally saw strong selling by SPX 2x ETF dumb money, but sentiment not at levels to support a strong rally. Decline may continue to late Dec.
2018.12 #4 Sentiment indicators move to BUY with SPX move to low 2400s. SPX 2x ETF dumb money at panic extreme. Expect rally thru EOY-early Jan, but tax loss selling may push SPX to 2350 first. Int rate cycles 1998-2010 show Fed not likely to change unless Unempl > 4%. Tech indic show bottom is near w/400+ pt SPX rally possible.
2018.12 #5 Sentiment indicators mostly indicate an INT bottom similar to Mar-Apr 2018 w/400 SPX rally to follow, but SPX ETF indicator remains near neutral. Closest analog is LTCM crisis of 1998 that fell 21% in six weeks with a retest a few weeks later. A retest may explain the SPX ETF signal weakness.

Saturday, February 17, 2018

Mixed Crosscurrents

The last six trading days saw a flash melt up with the SPX regaining over 60% of its late Jan-early Feb melt down.  The traditional sentiment measures can barely keep up, so this week I want to focus on the six to 12 month outlook.  With a new options exp month (March), I will look at SPY, GDX and VIX open interest.  The technical indicator section will also show an update to the 1994 analog.

I. Sentiment Indicators

The overall Indicator Scoreboard (12.5, 25, 50 day EMAs) shows a sharp rise in bearish sentiment with the 12.5 day reaching the BUY, but the longer term 50 day only neutral.  There is no evidence of a new bull market phase.


The Short Term Indicator (VXX $ volume and Smart Beta P/C) has reached the 2015 flash crash levels for the two shorter term EMAs, but the longer term has started to roll over.  Given the huge jump in volatility with the two days of DJIA 1,000 pt drops the previous week, the change in sentiment is much more in line with expectations than the huge run up in Aug 2016 with only a 2% drop in stock prices.


Looking at the Short Term Indicator with short term EMAs (2.5, 5, 10 days), sentiment has now dropped to a similar level as the V bounce from the Aug 2015 flash crash before a retest occurred.  So this suggests that a retest of the lows may occur over the next few weeks.


Bearish bond sentiment (TNX) has continued to rise (6-12 month outlook) so it's possible that interest rates may not rise much further.  This would probably be consistent with the stagflation outlook with weak growth, but higher inflation.


The gold miners (HUI) bearish sentiment (6-12 month outlook) continues to fade as the miners appear to be stuck in quicksand with nowhere to go.


II. Options Open Interest

Back again.  This week I will take a look at next weeks SPY (close 273.1, SPX 2732) for Wed and Fri and the March monthlies for SPY, GDX and VIX.  For the SPY on Wed, call resistance starts at 270 with little put support until 260.  At 273, delta hedging could push up to resistance at 275, but below 270 prices could fall dramatically.


For Fri, strong put support could push prices up to first resistance at 272 or higher.


For SPY March monthlies, the "most likely" is 272-3, but a move below 270 could fall to 265.


For GDX (close 22.5), put support is likely to keep prices above 22. but upside is limited to about 24.  "Most likely is 23, but a move below 22 could go to 21.  Limited upside with more downside risk.


For the VIX (close 19.5) for Mar 21, there is significant put support at 15 and call resistance above 21.  If VIX call buyers are "smart money" a trip to 21 or 25 seems likely before expiration.


III. Technical Indicators

So far so good with the 1994 analog shown last week.  Below is a 3 month chart from mid Jan to mid Apr 1994.  We should be at the day before the 475.1 high.  The last 3 day holiday was MLK day with the public "FOMOing" at the mouth after a record run up in stock prices the previous week.  The result was a strong "pop and drop" and hopefully we see the same next Tues.


The following is an updated table hopefully with an easier to follow timeline.  I did notice that I missed the 475.1 top using the prior days high and that was corrected.  The result was a higher projected 2nd Feb high of 2736 and since the SPX prior high of 2727 was 22 pts higher than 2018 proj, the revised projected high would be 2758.  I penciled in the Fri high at 2754 just in case, but hopefully Tues AM will show a new high.  Next could be a two day drop down to about SPX 2600, then a rally back of about 110 pts.  Oddly, this is about the same as the potential shown by the options open int for next week.


Looking forward to the lower early March low, I expect this to be around the next jobs report which was Feb 2 for Jan jobs, but the BLS is reporting that Feb jobs will be out Mar 9 so some timing differences are expected to start appearing.  Remember Feb 2's SPX 50 pt drop was followed by by Black Mon/Tue's additional 180 pt drop, so people are likely to be very antsy next time.

Conclusions.  Stock sentiment indicators are not pointing to the immediate resumption of the bull market, and the short term ST Indicator is showing that a retest of the lows is likely soon.  Both options open int and the 1994 analog (warning, these always fail sooner or later) point to a potential sharp drop early next week to as low as SPX 2600 before an end of week rally back over 2700, so we could have an exciting week.  The outlook beyond the next couple weeks is muddled by the outlook for interest rates.  Both 1994 and 1999 saw a sharp rise in interest rates and fall in stock prices the last half of Feb, likely from the economic pickup from warmer weather, and the main difference was that in 1994 rates continued to rise sharply thru mid year, unlike 1999.  Bond sentiment may be showing that the rise in rates could slow which would be more bullish for stocks than 1994.

Weekly Trade Alert.  Last weeks upside target was met, but no lower price entry presented itself.  Next week should be easier unless we gap down Tues AM.  Look for short on SPX 2750-60, hopefully new high over 2754 with stop at 2770.  Target low 2600s, then long for 2700+ target on bounce.  Updates @mrktsignals.

Investment Diary, update 2017.10.28, Indicator Primer
Article Index 2018 by Topic
Article Index 2017 by Topic
Article Index 2016 by Topic
Long term forecasts

© 2018 SentimentSignals.blogspot.com

Saturday, February 10, 2018

Is the Trump Rally Kaput?

Today I will use a slightly different format, looking at the basic indicators using both normal and long term EMAs to try to determine if the bottom is in for stock prices or whether we are beginning a longer term bear market.  Some interesting similarities exist between now and 1987.  Alan Greenspan was sworn in in Aug 1987 while the DJIA was in the middle of a 10% correction after a melt up that was followed by an October crash two months later.  Last week Jerome Powell was sworn in also in the midst of a 10% correction after a melt up, what can we expect next?  The 1987 crash was attributed to financial engineering's use of portfolio insurance and the result undoubtedly had Greenspan leaning toward "loose money" at every hint of trouble.  Is Wall Street giving Powell the same indoctrination?

Last Sunday I googled "bond market crash" and came up with 1994, and in the technical indicator section will take a close look at what happened to stocks and interest rates then and how now may not be like 1987, but not much better.

I. Sentiment Indicators

The overall Indicator Scoreboard saw a large jump in bearish sentiment, but the lagging 20 day EMA is only at the 0.0 level matching early levels of the 2015 flash crash and Jan 2016 selloff.  Rebounds, more volatility and retest of the lows seem most likely.


The Short Term Indicator (VXX $ volume and Smart Beta P/C) moved to levels higher than any time over the last three years.  As we saw in Aug, in time of strong liquidity support, this can result in stock melt ups, but the longer term outlooks below are not immediately supportive.  VIX $ Volume is more extreme suggesting volatility compression is likely.


Bond sentiment (TNX) shows increased levels of bearishness that could lead to a consolidation with modest support for stocks, but not at levels to support a turn around in rates.


The gold miners (HUI) sentiment has barely moved even though prices are testing their 12-month lows.  This supports the options OI results for GDX from a couple of weeks ago that showed resistance at 25 (tagged) and support at 23 but not much to stop a strong move if either was breached (Fri was below 21).


II. Long Term Sentiment Indicators (5X, 25, 50 & 100 day EMA)

The long term overall Indicator Scoreboard shows a clear long term down trend in bearish sentiment since the flash crash of Aug 2015 with a SELL being generated at the Jan top.  The indications are that this is likely a multi-year top in stocks, ie, start of a bear market.


The Short Term Indicator (VXX $ volume and Smart Beta P/C) is similar but somewhat more supportive with the 100 EMA reaching the BUY level.  This could be simply the same as the early 2015 flash crash era so that a multi month consolidation occurs.


The long term CPC (combined put/call ratio) revised (less VIX puts & calls) mirrors the Indicator Scoreboard, indicating probable bounce but no bull market continuation.


III. Technical Indicators

Again, no options OI this week.  So let's start with the "bond crash" of 1994.  I am not sure why this is called a crash as there have been other sharp rises since, but it did mark the peak in rates for the next 25 years as the TNX rose from 5.15% late 1993 to 8.16% late 1994 most in the first half of the year.   The equivalent today would be a rise from 2.5% to 4.0%.


What I found most interesting was the performance of the stock market during this period.  The 1994 period followed almost textbook TA, unlike 2018.  Here goes, strong rally into end of Jan, strong selloff first week of Feb (A), wedge or expanding triangle with lower lows and retest trendline (B), breakdown with H&S with less volatility (C > A), sharp rally as ED after 200 day SMA broken (D), crash (twice A or C) to 600 day SMA (E).


For reference to why the 600 day SMA might be important, look at 2015-2018.  Aug 2015, flash crash went solidly thru it and today it stands at SPX 2268.  Are we headed to the SPX 2200 level?


To put some numbers to the charts, I downloaded some historical data from Yahoo finance and put into Excel.  Here, I used the ratio of the January advances as a multiple and assumed that A and C are combined since we already tested the SPX 200 day SMA.  The result projects to a low of SPX 2599 which is close to the first low, but higher than last weeks low of 2533.  This scenario would probably have 6 weeks or so of consolidation before a final low of SPX 2365.


In the second scenario, which I call the "doomsday scenario", I use 165% of the ratio of the Jan advances.  I know this sounds far fetched, but the timing patterns for Feb (wedge) indicate a higher high next week (SPX 2740-50ish), followed by a decline the next week then a lower high for a H&S (SPX 2720ish), then another late month selloff to SPX mid-2400s,  So next couple of weeks should see how this works.  Then, of course, the late March crash.  I saw where one EW analyst made the same prediction for Feb using a "triple zig-zag", not an EW expert so can't comment.


Conclusions. This week I am focusing on the more bearish possible outcome due to the weakness in pullbacks in interest rates.  1999 saw a 50% retracement in TNX rates as stocks fell, but in 2018 rates rose from 2.5% to 2.9% and have only fallen to 2.82% with stocks down 10%.  The result is much more like 1994 and indicate that the SPX could fall to the 2200 level if rates rise to 3.5% or higher.  This would put the SPX back to the pre-election period and wipe out Trump's rally.  My conclusion is that the lower levels are unlikely due to the preponderance of EW analysts looking for SPX 2400 as a W4 bottom, increasing the likelihood of a stronger than expected rally (2750) before a possible 600 pt crash.

Last week I mentioned that there may be more to the end of month selloff related to QE unwinding and this week Tom McClellan states that in Jan, the Fed doubled its sales to $20 billion and dumped it all at the EOM.  Will the same the happen for a couple more months before the Fed switches tactics - perhaps selling at a discount to dealers or financial institutions?  How will this effect stocks?

Weekly Trade Alert.  Finally, we have some clarity to the market potentials.  One thing that keeps me hesitant about a direct rally to SPX 2750 is that my experience shows that support (200 day SMA) often occurs with the DJIA due to wider recognition by the public.  It is possible that Mon/Tue sees lower lows before a "turnaround".  Long SPX if DJIA test 200 day SMA (22,800), target SPX 2720+.   Updates @mrktsignals.

Investment Diary, update 2017.10.28, Indicator Primer
Article Index 2017 by Topic, sorry, falling behind, will catch up soon
Article Index 2016 by Topic

© 2018 SentimentSignals.blogspot.com

Saturday, February 3, 2018

A Funny Thing Happened on the Way to Nirvana

Contrarian Rule #1, when everyone thinks the same thing is going to happen get ready for a surprise.  Since June, I had been waiting for a bubble/meltup to end this bull market, but when everyone began to agree I should have seen this coming.  That being said, I quickly followed up on Twitter Tue AM when the SPX opened below the critical level of 2850 that we were likely following the fractal of Dec 98-Jan 99 where a three week rally of 10% was followed by a 50% retracement in one week.  The 1999 period also saw sharply rising rates with the TNX going from 4.5% to 5.5% thru May, but the bond market acted differently last week so this time may be different. All of the ingredients are present for a "perfect storm" in bonds that could crash the stock market as much as 20% the first half of the year.  I want to start with a special section on bonds explaining the potential for a "perfect storm".

I. What's Up with Bonds

First, I want to briefly explain how the bond market operates.  Only about 60% of US bonds are held in the US with the rest mostly China at 20% and Europe at 20%.  Due to Trump's weak dollar policy with the USD down 10%, foreign bond holders are down 10%.  Add Trumps militaristic attitude toward China, "me first" trade policies, and rejection of Europe's global warming agenda, foreign bondholders are likely to be net sellers.  

Within the US about 80% of bonds (excluding Fed) are held by financial institutions (banks, insurance cos, and pension funds) with the remaining 20% mostly in retirement accounts.  When QE was implemented, the Fed might announce that it would buy $50 billion in bonds a month for the next 18 months for a total of $900B.  But then a funny thing happened as interest rates dropped before the Fed purchases as the financial institutions (FI) would "front run" (buy before) the Fed, this drove up the price of bonds so the FI would make a profit by selling to the Fed.  This was OK as one of the Fed's goals was to prop the profitability of the FI after the financial crisis ending in 2009.

Now with the Fed "unwinding" its balance sheet by selling bonds, it appears the FI are now "front running" the Fed's sales of bonds, but unfortunately as we see often in the stock market, selling often begets more selling as panic sets in driving bond prices lower and interest rates higher than is normal.  When we add to the pressure from the Fed's unwinding, the pro-growth inflationary policies of Trump, and the negative foreign influences you have the potential for a "perfect storm".  At the current rate of increase for the last five weeks for the TNX that works out to 4.0 to 4.5% by mid-year (my forecast for mid-2020) to 6.0 to 6.5% by EOY.  For the stock market, this would result in approx a DJIA 5,000 pt drop by mid-year and 10,000 drop by EOY.  If it does happen I expect the Fed to suspend QE unwinding and interest rate hikes by mid-year.  Longer term this will raise questions about the further use of QE.  Fortunately for China the politburo can simply call the FI CEO's and threaten jail time or the firing squad for selling.  Check out the Technical Indicator section for how less bond volatility may lead to higher stock prices.

Ii. Sentiment Indicators

The overall Indicator Scoreboard saw a strong bounce relieving the strong SELL, but remains well short of a buy, so only partial retracements of the selloff are expected.


The Short Term Indicator (VXX $ volume and Smart Beta P/C)  has reached the moderate BUY level similar to the July 2015 and Sept 2016 selloffs that lead to partial retracements.


Looking more closely at the ST Components, the VXX $ volume has reached a fairly strong BUY level somewhat similar to Sept 2016.  The two month retracement period before the early pre-election plunge is consistent with the volatility compression likely with this indicator.


The Smart Beta P/C has only reached the weak BUY level that is also consistent with the Sept 2016 SPX selloff of 80 pts that was followed by a sharp short term retracememt and a two month consolidation before the Nov plunge.


The NDX short term ETFs SQQQ/TQQQ bearish sentiment is now at the highest level seen in the last three years.


Looking at some of the other sectors, the small cap RUT (TZA/TNA) sentiment remains near neutral.


While the banking sector (FAZ/FAS) which has been on fire so far due to higher rates seems to have the most to lose longer term (if higher rates = housing crisis 2).


Bond sentiment (TNX) seems the most perplexing given the sharp run up in rates the last five weeks as bearish sentiment has actually dropped to neutral.  This is the epitome of complacency as the public is not worrying about a bond bear market.  In mid Dec, one well followed analyst recommended bonds over stocks as he felt the 2.5% yield was "risk-free" compared to stocks.  Since then stocks are up 3% (6% two weeks ago) and bonds are down 3%.


The gold miners (HUI) sentiment was virtually unchanged as the HUI dropped sharply, moving inversely with interest rates as expected.


III. Technical Indicators

I am skipping the options open interest section this week in lieu of the special bond and extended technical indicator sections.  After posting the long term SKEW chart for the 2008-09 bear market on Sat, Sun I followed up by researching the 2000-02 bear market and found a somewhat less bullish outcome when the SKEW dropped below its uptrend.


The SKEW EMAs were much closer to the current EMAs, and the SPX had rallied 10% in three weeks in a vertical move up between mid-Dec and early Jan following a 20% three month selloff due to the collapse of the LTCM hedge fund.  The entire decline occurred over five days following the strongest move up retracing 50% of the advance, sound familiar.


The six months that followed the beginning of the advance saw rising rates and stock prices.  It is hard to tell if we will see a similar trend now, but the Fed's stimulus then could be replaced by Trump's tax cuts now.  What we saw then were stock declines when rates rose, with stock rallies when rates declined or consolidated.  Overall, the next 18 months following Jan 1999 dovetail Avi Gilberts long term outlook.


IV. Other

Last week also saw a VIX Call Indicator BUY as the VIX Call 10 day SMA rose by 54% over the avg number of VIX Calls with the SPX below its 20 day SMA.  Friday was actually very interesting with over 3M calls or 10x avg while the puts were over 1M or 6x avg.  Both were the highest in my DB back to 7/6/2010.  You decide which is the "smart" and which is the "dumb" money.


Conclusions.  Last week I was expecting one more push higher before a 3-5% pullback this coming week, but again I ignored the VIX call indicator SELL signal from Jan 13 as last week was week 3.  I have been warning that move in the TNX over 2.7% could be trouble for stocks and Mon AM jump over 2.7 seemed to be all that was needed for a selloff.  No matter what other indicators may say interest rates (TNX) are likely to be the main driver of stock prices over the short to medium term.  Looking at the 1999 analog, stocks can rise while rates are in a long term uptrend, but are likely to fall short term when rates rise.  What bothers me most is the rapidity of the current rate rise at .45% in five weeks which is 2% in six months or twice the 1999 amount where rates were twice as high to start.  Sentiment points to a strong bounce (possible 62% retrace) with an extended consolidation to compress volatility, but more downside is likely later.  TNX over 3% next 2 to 4 weeks could be catastrophic and lead to a repeat of the LTCM type selloff late 1998.

If there are "selling binges" in bonds these may be periodic.  With QE, the Fed bought on the 15th and EOM each month which may explain the pickup in volatility mid and late Jan.

Weekly Trade Alert.  We may have a few days of chase the rip, but until I get a better idea of what is happening to bonds, it's too hard to call.  Updates @mrktsignals.

Investment Diary, update 2017.10.28, Indicator Primer
Article Index 2017 by Topic
Article Index 2016 by Topic

© 2018 SentimentSignals.blogspot.com