
I. Sentiment Indicators
The overall Indicator Scoreboard (INT term, outlook two to four months) dropped sharply last week and seems to be bottoming in the area of the July 2017 top rather than the Jan top, so a repeat of the Jan-Feb crash is not expected.

The INT view of the Short Term Indicator (VXX $ volume and Smart Beta P/C, outlook two to four months) remains in an area that is similar to Jan, so a sizable pickup in volatility is expected soon.

Bond sentiment (TNX) showed a sharp pickup in bearish sentiment as rates rose near to the 3.0% level. Much of the rise may be due to recent weakness in the dollar, but I still think that a stronger dollar and somewhat weaker rates are expected into the 1st half of 2019.

For the INT outlook with LT still negative (note, BUY for INT term equals neutral LT), the gold miners (HUI) bearish sentiment dropped sharply as many analysts are again calling for a bottom and new bull market, but this doesn't line up with the DUST/NUGT ETF sentiment.

II. Dumb Money/Smart Money Indicators
The Risk Aversion/Risk Preference Indicator (SPX 2x ETF sentiment/NDX ETF sentiment, outlook 2 to 4 days/hours) as a very ST indicator remains near the bottom of its TL and is a topping indicator.

The option-based Dumb Money/Smart Money Indicator as short/INT term (outlook 2 to 4 days/weeks) came close to a complete reversal from the Mon BUY and likely to generate a ST SELL next week.

The INT term SPX Long Term/Short Term ETFs (outlook two to four weeks) bearish sentiment was little changed for the week, but also appears to be forming a similar pattern to July 2017 period that saw a big jump in volatility, but not a large decline.

Long term neutral, the INT term NDX Long Term/Short Term ETF Indicator (outlook two to four weeks) again the cyclicality makes this hard to interpret, so this week I am going to add the 2x and 3x ETFs that show overall high bearishness is not similar to a major top.

The NDX 2x QID/QLD ETFs (dumb money) indicate a high level of bearishness.

While the NDX 3x SQQQ/TQQQ (smart money) show only neutral sentiment. The conclusion is that a pullback/correction ST is not likely to be the beginning of a bear market.

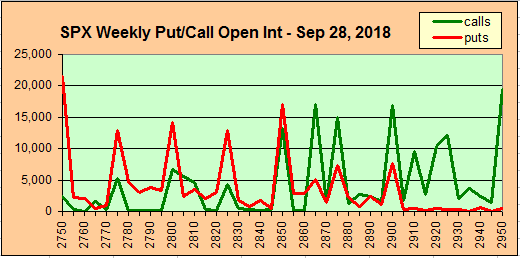
III. Options Open Interest / Other
Using Thurs close, remember that further out time frames are more likely to change over time. This week I will look out thru Sept 28.
With Fri close at SPX 2905, a hold over 2900 can cause delta hedging with light resistance up to 2950. A break below 2900 could fall to 2875. Light open int overall.

Wed shows call resistance increasing up to SPX 2930 with strong support at 2840.

Fri opt exp has most of the options as hedges in the AM, but is similar to the PM where there is strong resistance at SPX 2900 and above with the potential for a drop to the 2850-75 level. For the week, a Mon/Tue rally over SPX 2920 should be reversed by EOW.

For the following Fri (EOM) has large option positions with strong call resistance at SPX 2865 and higher. So there is likely to be some weakness toward the 2850 area by the EOM.
A couple of weeks ago, I resurrected the VIX Call Indicator, point out that the extremely low VIX call vol was similar the Jan 2017 that saw a brief decline followed by a strong rally then a correction. We got a brief decline and the Aug rally and last week the VIX Call indicator rose by 19% of the avg with 50% (0.5) as a rise from a recent low a SELL. Remember that there is usually a 1-3 week lead before a large decline. I will be using a SELL as an entry signal for a VXX position that historically has returned 30-50% over the following 4-6 wks with a maximum drawdown of about 10%.

Conclusions. Possible tropical storm, but no hurricane on the horizon. I am expecting a 5-7% pullback in Oct before a possible final year end rally that may top SPX 3000. In addition to the August tops discussed last week, there is also a mid-term election factor. Sentiment is the over riding factor, however, and the first VIX Call Indicator SELL since Jan would strongly support the historical trends.
Weekly Trade Alert. A top next week may not be followed by a sharp decline immediately, but I am looking for the DJIA to fill the Jan 29 gap at 26,440 before a sizable decline begins. Options open int point to possible weakness by end of next week or EOM at the latest. We could see something like Dec of 2015 where volatility picks up gradually, then explodes due to some external event. Updates @mrktsignals.
Investment Diary, Indicator Primer, update 2018.03.28 Dumb Money/Smart Money Indicators
Article Index 2018 by Topic
Article Index 2017 by Topic
Article Index 2016 by Topic
Long term forecasts
© 2018 SentimentSignals.blogspot.com
No comments:
Post a Comment